< Previous | Contents | Next >
View temperature and light readings from smart detectors on the METEO tab.
To find the METEO tab, in the DEVICES tab, select a smart detector and in the examination pane, click METEO. You can only open devices with the smart sensing icon in the METEO tab. For more information, see smart sensing in Navigating the Devices tab.
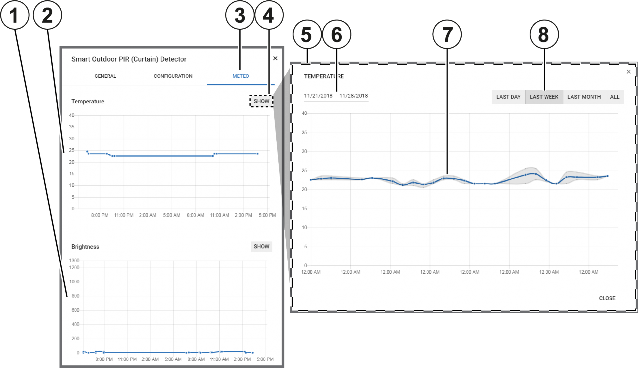
Figure 18. Navigating the METEO tab
Callout | Name | Description |
1 | Brightness graph | View the brightness readings over a period of time. The x-axis represents the selected time period and the y-axis represents the brightness in lumens. |
2 | Temperature graph | View the temperature readings over a period of time. The x-axis represents the selected time period and the y-axis represents the temperature in degrees Celsius. |
3 | METEO tab | Click to open the METEO tab. |
4 | SHOW | Click to view a more detailed graph. |
5 | Detailed graph | A more detailed version of the graph. Change the y-axis with a preset time period or manually change it to a custom time period. For more information, see Statistical period and Custom statistical period. |
6 | Custom statistical period | Click to enter custom time period dates that change the x-axis of the graph. |
7 | Graph line | Each point on the graph has multiple readings. The gray lines represent the minimum and maximum readings and the blue line is the average reading. |
8 | Statistical period | To change the x-axis of the graph with a preset time, click LAST DAY, LAST WEEK, LAST MONTH, or ALL. |
Related topics