Automation Log
Overview
The Automation Log screen in ConnectAlarm lets users review the execution history of Home Automation rules.
Use this page when users need to:
- Check whether automation rules ran successfully.
- Review failed automation executions.
- Filter automation logs by date.
- Confirm when an automation action was recorded.
This page helps users troubleshoot automation behavior and verify whether configured rules ran as expected.
Before you begin
Preconditions
- The user is signed in to the ConnectAlarm app.
- The selected security panel is available.
- At least one automation rule exists or has existed.
- At least one automation rule has run, if the user expects log entries to appear.
Dependencies
- Automation logs depend on Home Automation rule execution history.
- Log entries depend on communication between the app, PowerManage server, security panel, and target devices.
- Successful and failed status reporting depends on the result returned by the PowerManage server and security panel.
Limitations
warning
- Logs will not appear if no automation rule has run.
- Logs will be delayed if the security panel or PowerManage server connection is unavailable.
- A failed log entry may require checking the related rule, panel state, or target device.
Page layout
The Automation Log screen shows filters, grouped log entries, and an empty state when no records match the selected filter.
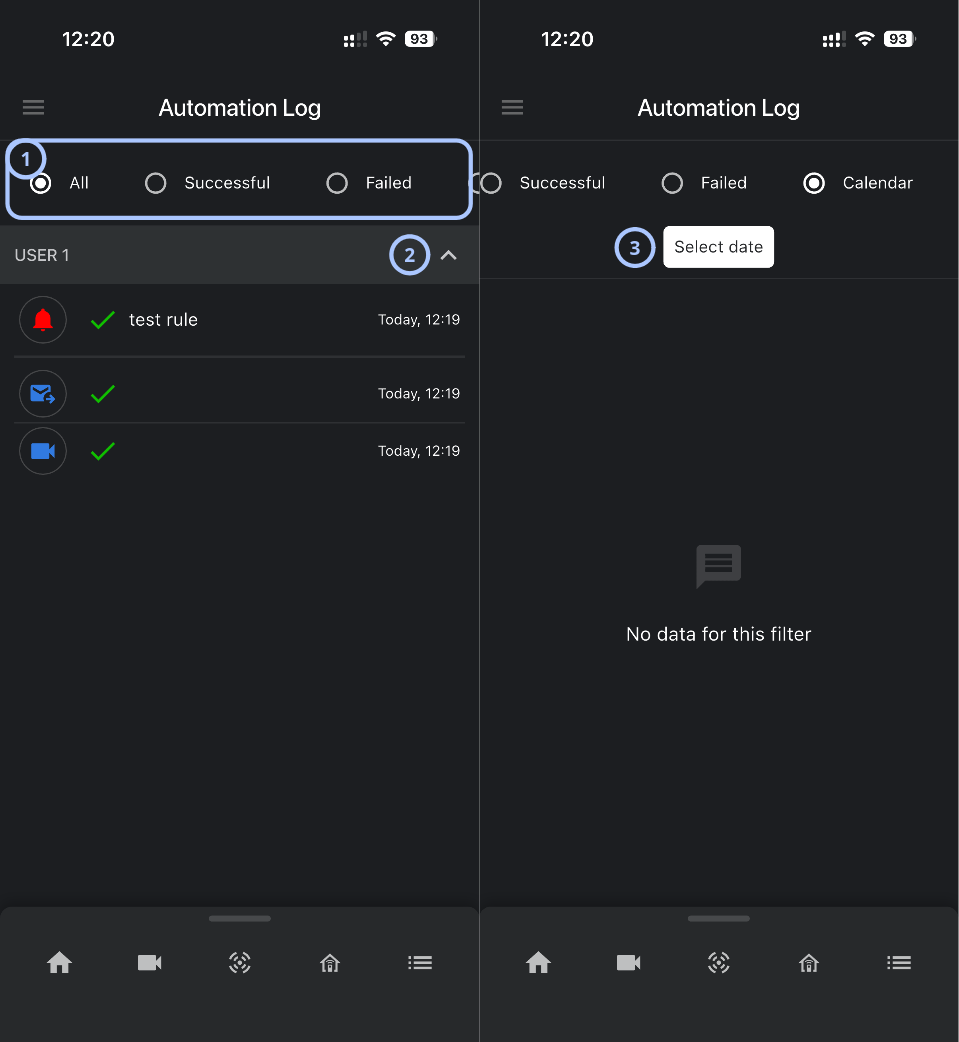
| Callout | UI element | Description | When to use |
|---|---|---|---|
| 1 | Log filters | Filters automation log entries. The available filters are All, Successful, Failed, and Calendar. | Use to review all log entries, successful executions, failed executions, or entries for a selected date. |
| 2 | Expand/collapse control | Displays or hides the actions executed during an automation rule. | Use to review, expand, or collapse log entries for a specific user. |
| 3 | Select date button | Appears when the Calendar filter is selected. Opens date selection for log filtering. | Use to review automation logs for a specific date. |
How to use this page
Open Automation Log
- Open the ConnectAlarm app.
- Sign in to your account.
- Sign in to your security panel.
- Open the
 menu.
menu. - Select Automation Log.
View all automation log entries
- Open Automation Log.
- Select All.
- Review the log entries under each user or source group.
View successful automation executions
- Open Automation Log.
- Select Successful.
- Review the filtered list.
note
A successful entry means the automation was reported as successful by the system. If a physical device did not change state, check the device status separately.
View failed automation executions
- Open Automation Log.
- Select Failed.
- Review the filtered list.
Filter automation logs by date
- Open Automation Log.
- Select Calendar.
- Select Select date.
- Choose the required date.
- Review the filtered results.
Tips
tip
- Use All first when looking for a rule run. Then use Successful, Failed, or Calendar to narrow the results.
- Use the Failed filter when troubleshooting automation rules that did not behave as expected.
- Use the Calendar filter when investigating an issue reported for a specific date.
- If the list is long, collapse executed actions list that are not relevant.
Troubleshooting
| Problem | Possible cause | What to try |
|---|---|---|
| Automation logs do not appear |
|
|
| A rule is missing from the log |
|
|
| Failed automation entries appear |
|
|
Related pages
Was this page helpful?