Navigating the Events page
View a list of all panel events on the Events page.
Filter the Events page to return a match of specified criteria that you set in the search bar. Filter your search with one, or a combination of the following criteria: SEVERITY, PANEL ID, PANEL NAME, ACCOUNT, HAS VIDEO, DATE and TYPE. You can save required search criteria by using the search filter function. For more information, see Using the search filter.
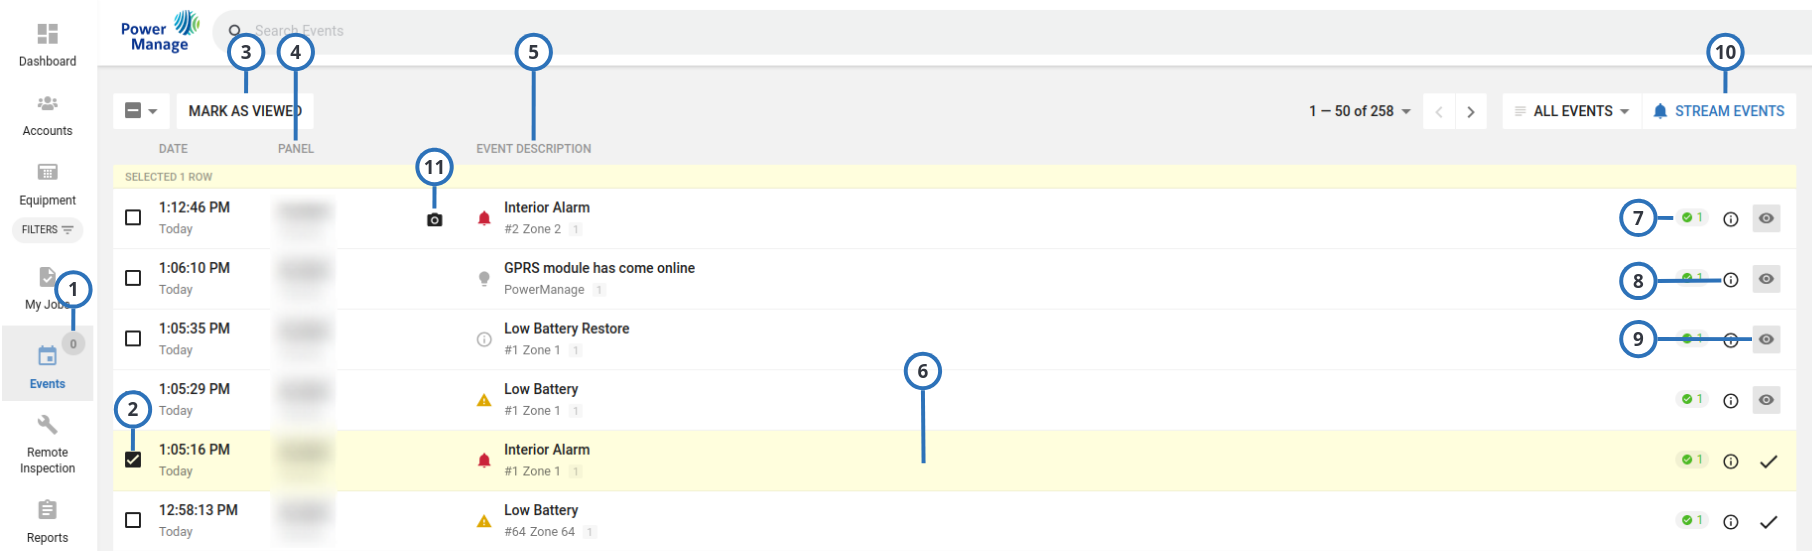
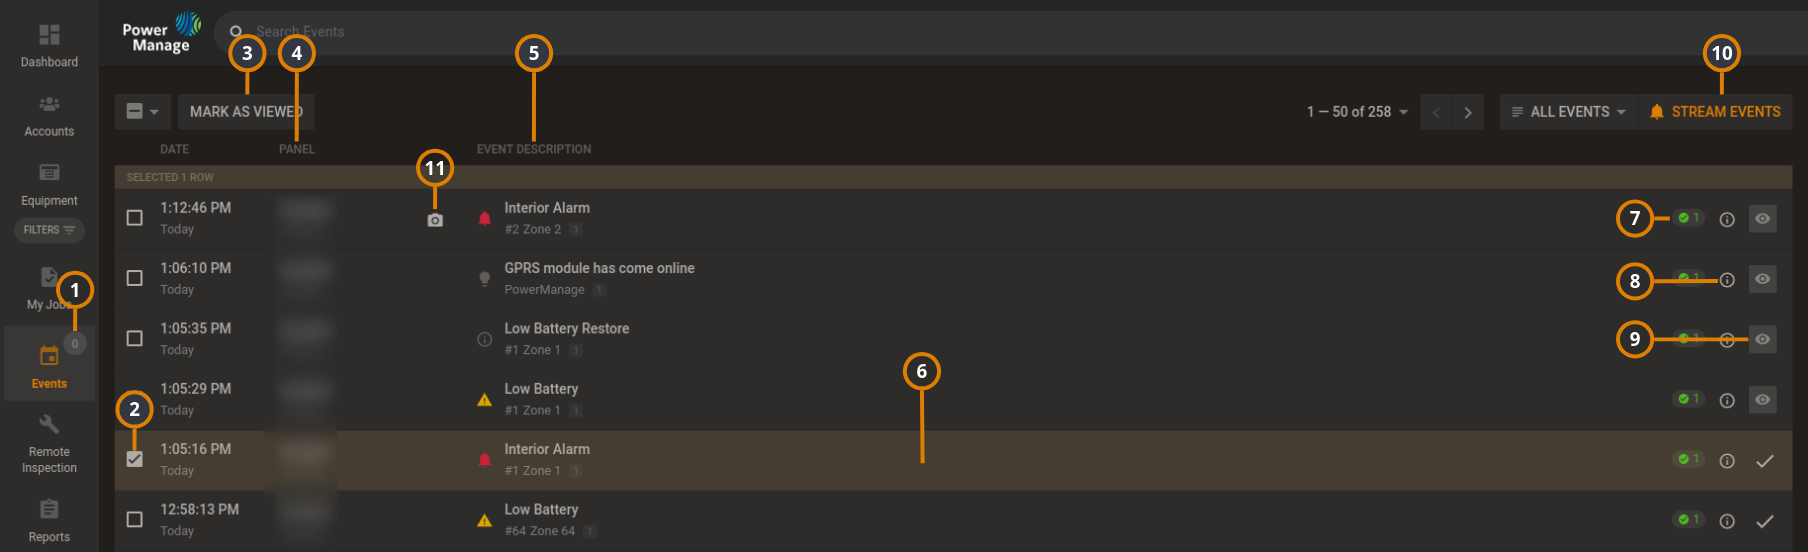
Figure. Navigating the Events page
| Callout | Name | Description | |
|---|---|---|---|
| 1 | Events since last logon | Displays the number of unresolved events since the user last visited the Events page. To enable the notification, from the user icon list, select Settings and turn on Enable alarm supervision. For more information, see User icon in Navigating the UI. note When you press SAVE CURRENT SEARCH button on search field, the FILTERS menu is added under Events | |
| 2 | Check box | Select the check box of one or more events to enable MARK AS VIEWED. | |
| 3 | MARK AS VIEWED | Click MARK AS VIEWED to mark multiple events as viewed. This button has the same function as the Viewed icon, but it can be performed on more than one event. danger Only mark an event as viewed if your investigation is complete. | |
| 4 | Panel name | Click the panel name to open it in the Equipment hub on the DEVICES tab. For more information, see Equipment hub. | |
| 5 | Event description | The offline notification icon appears if the PowerManage server does not receive a keepalive message from the panel. note Define the delay between the panel's last keepalive message and the offline notification in the Groups page. For more information, see Group parameters. | |
| The online notification icon appears if the PowerManage server receives regular keep alive messages from a panel that was offline. | |||
| Trouble icon appears next to the event in the SEVERITY column if there is a trouble event, such as a low battery, AC fail, gas, or flood alert. | |||
| Alarm icon appears if there is an event caused by a breach of security or safety. Examples of alarms include panic alarms, burglar alarms, and fire alarms. | |||
| Information event icon appears when a panel sends information about a device bypass, an auto test, or any other information messages. | |||
You can find the source of the event in the APPOINTMENT row. The source can be one of the following examples:
| |||
| 6 | View in examine mode | Click the Event row to open an event in Examine mode. | |
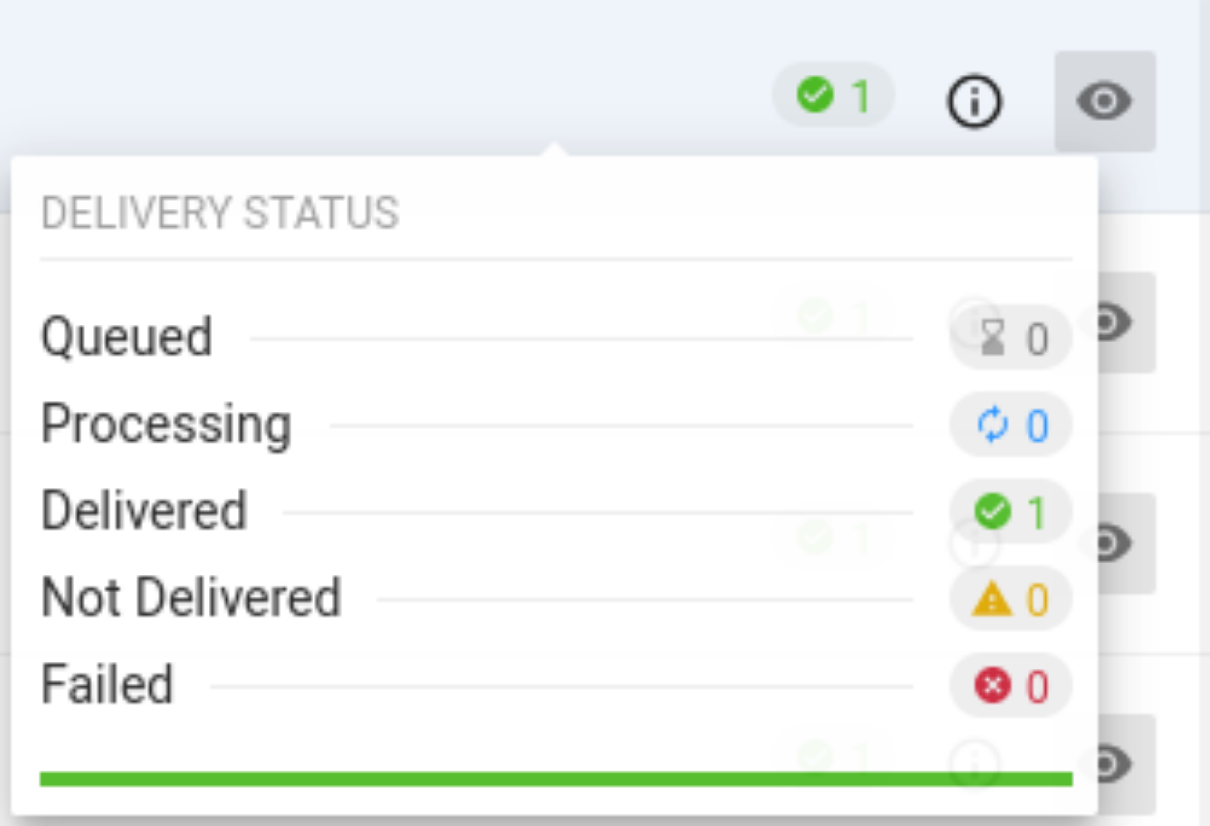
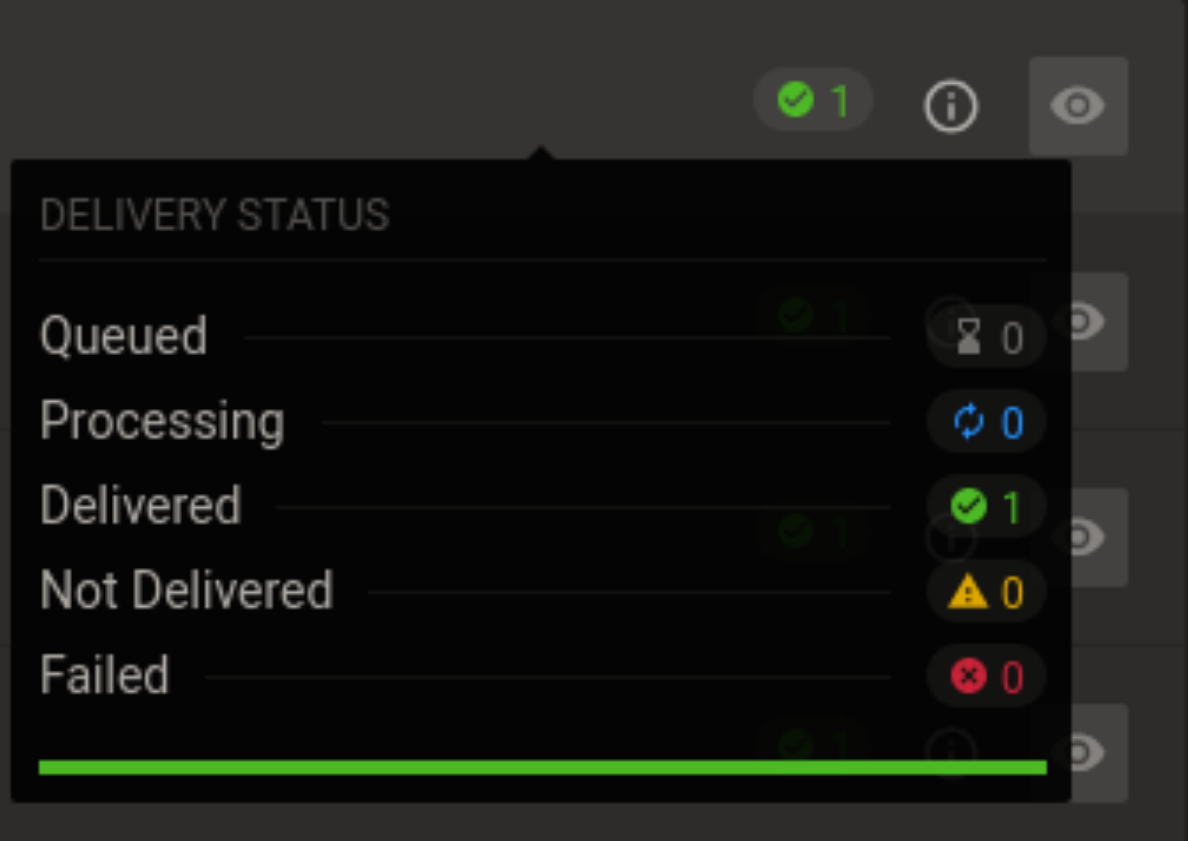
| 7 | Delivery status | Hover the cursor over the hourglass icon to display detailed delivery status. It can show:
note The icon is only present when the event should be sent to the CS. The total number of statuses needs to be equal to the number of CSs that the event is intended to be sent to. | |
| 8 | If the panel sends an event in SIA or CID format the | ||
| 9 | Viewed or unviewed icon | Click the Eye icon to view a report. When you view a report, a check mark replaces the Eye icon. note Only mark an event as viewed if your investigation is complete. | |
| 10 | Stream new events | Turn on the Stream new events toggle to update the Events page every time a new event occurs. note By default, the Stream new events toggle is turned on. | |
| 11 | Camera icon | The Camera icon indicates that video footage accompanies a particular event. | |
The Examination pane opens when you click an event row. You can view event video, live video, and delivery status:
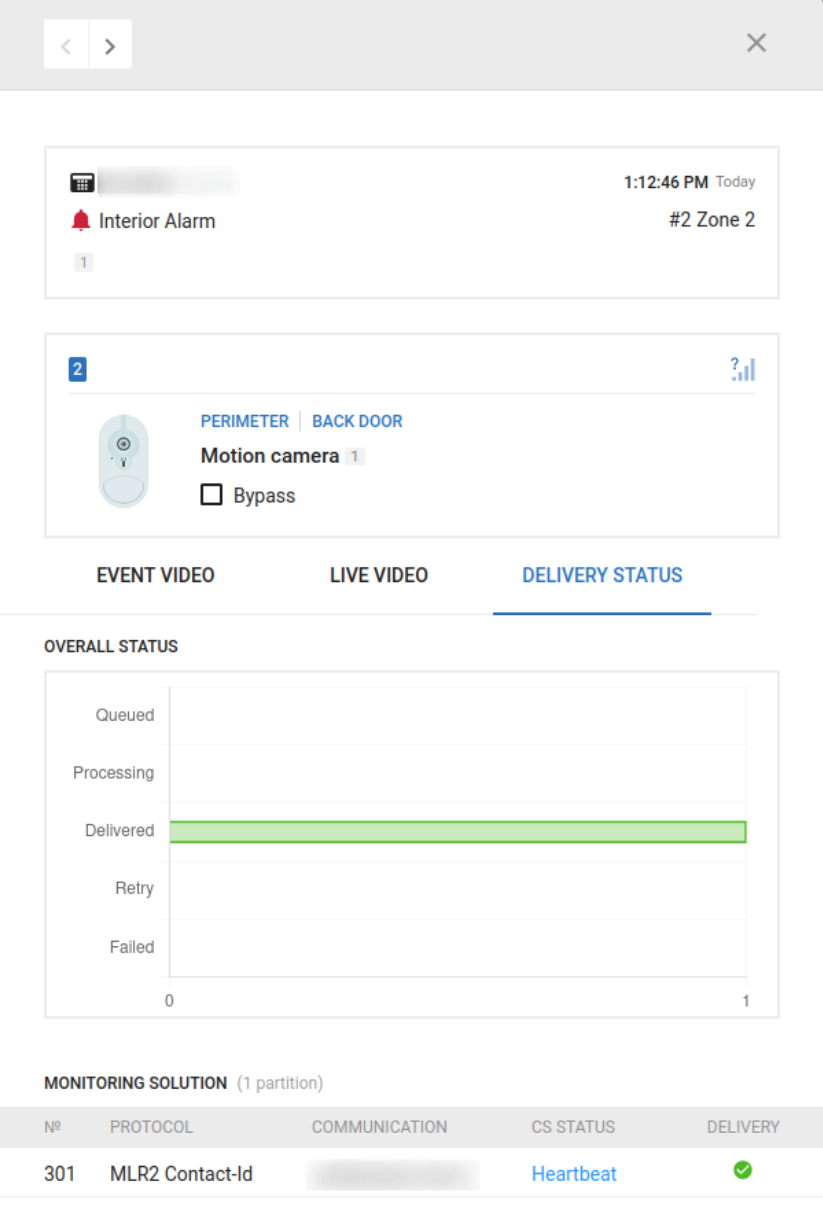
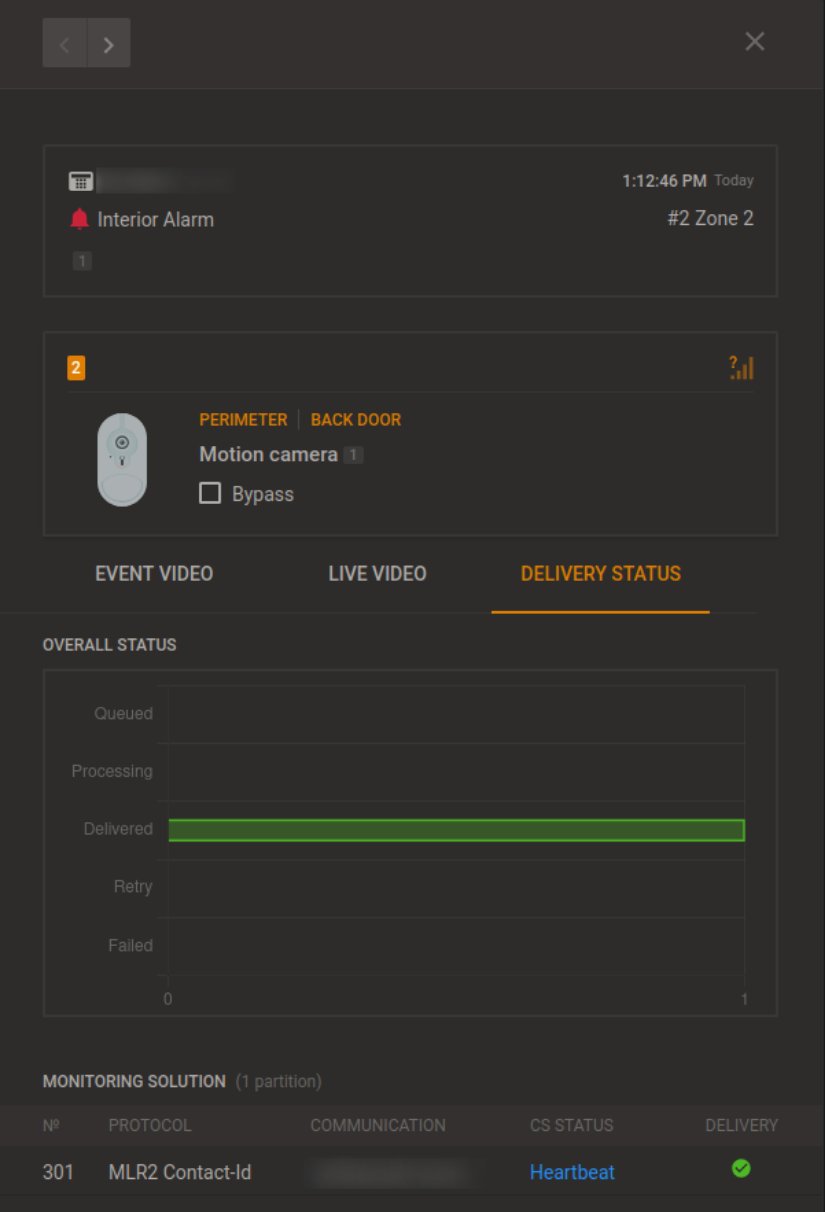
To see detailed delivery status in the panel row:
- Select user icon in the upper right of the screen.
- In Setting select Events delivery status view.
- Select Long.