Dashboard
Overview
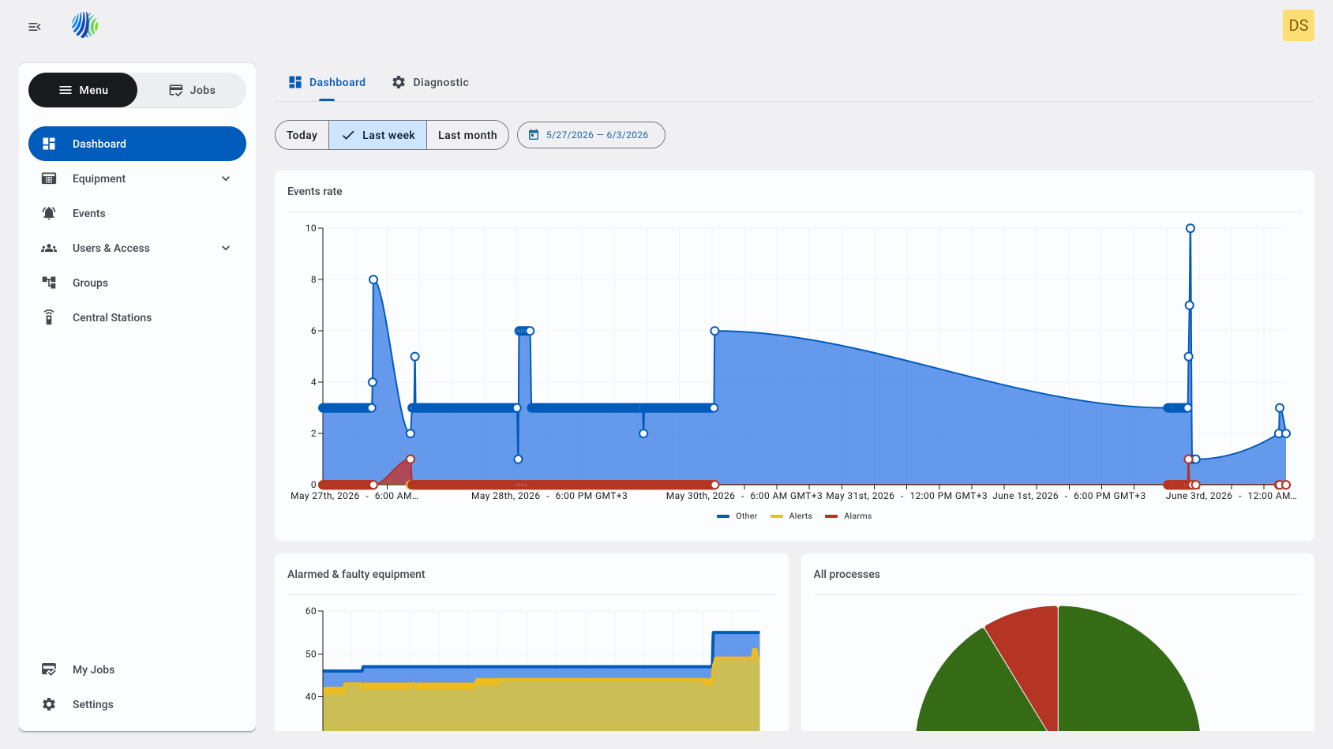
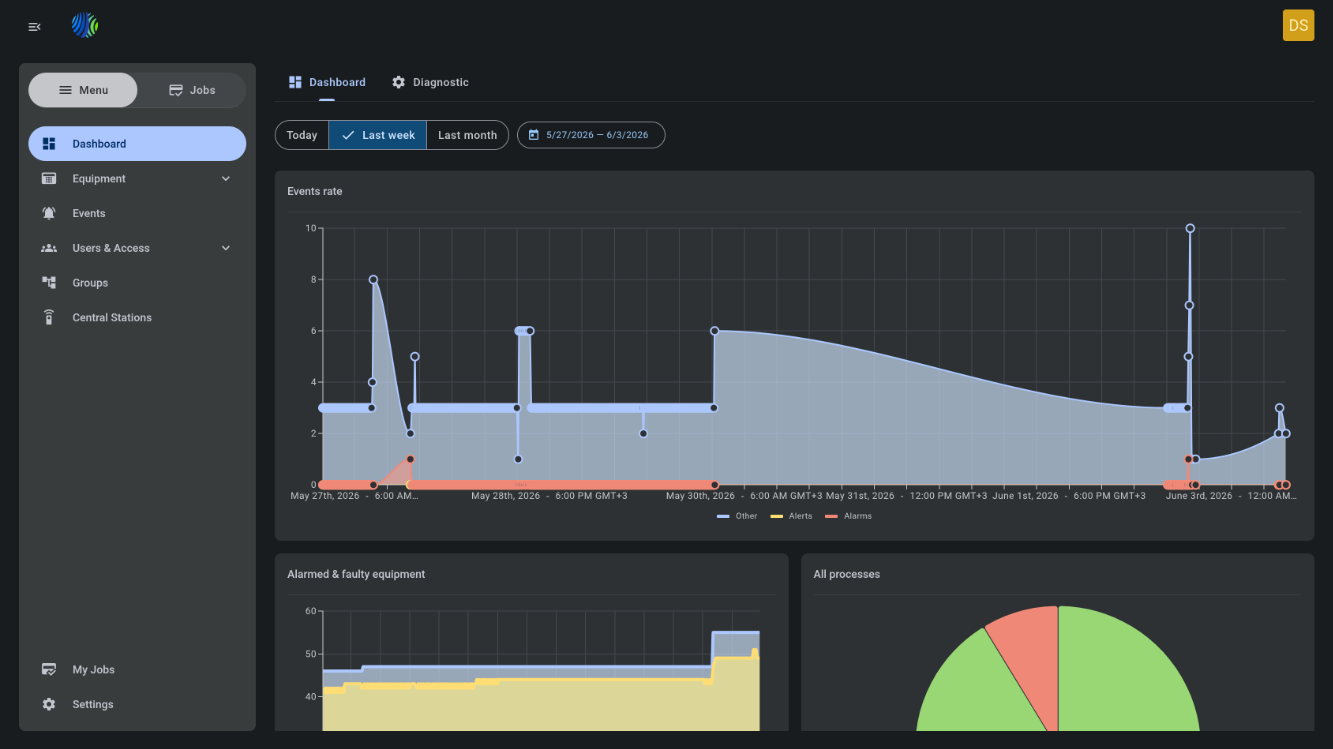
The Dashboard page provides a time-based overview of system activity and operational health using interactive charts. Use this page to:
- Monitor event volume and trends (alarms, alerts, other events).
- Track equipment state (alarmed, faulty, connected, online).
- Review process execution outcomes (started, handled, failed, succeeded).
- View accounts connection status.
- Review billing-related equipment statistics (when billing is enabled).
This page helps you spot spikes, outages, abnormal error rates, and changes in accounts or panel connectivity, and then navigate to the relevant detailed lists with the right filters applied.
Before you begin
Required permissions
- You must have permission to view the Dashboard.
- You must have permission to view the target detail pages that the charts link to Events, Equipment, Processes, Accounts pages.
Access to Dashboard page and charts is controlled by role permission group called "Dashboard".
Preconditions
- Your user account is active and not suspended.
- There must be data available for the selected time range; otherwise charts may show empty states.
Dependencies
- Dashboard data depends on the underlying data sources for events, equipment/panels, processes, accounts.
Important limitations
- Billing statistics are shown only when billing is enabled in license.
- The Dashboard page shows data only available to the current user.
Page layout
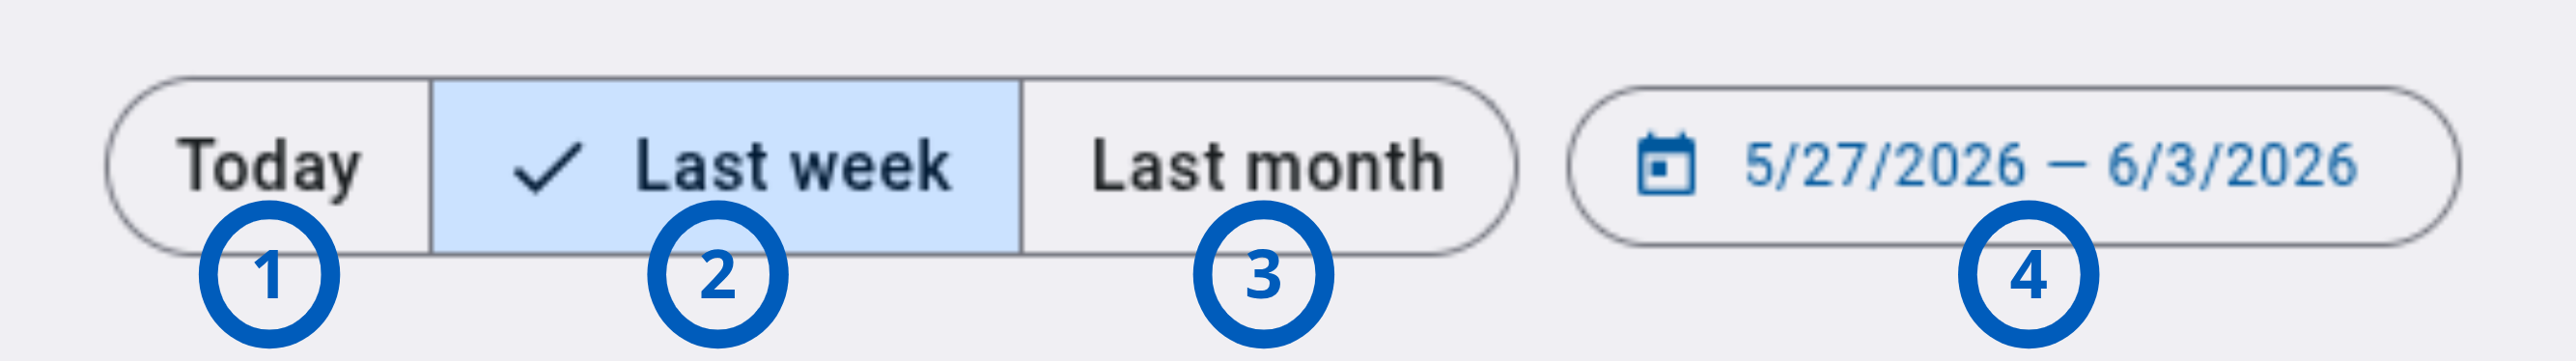
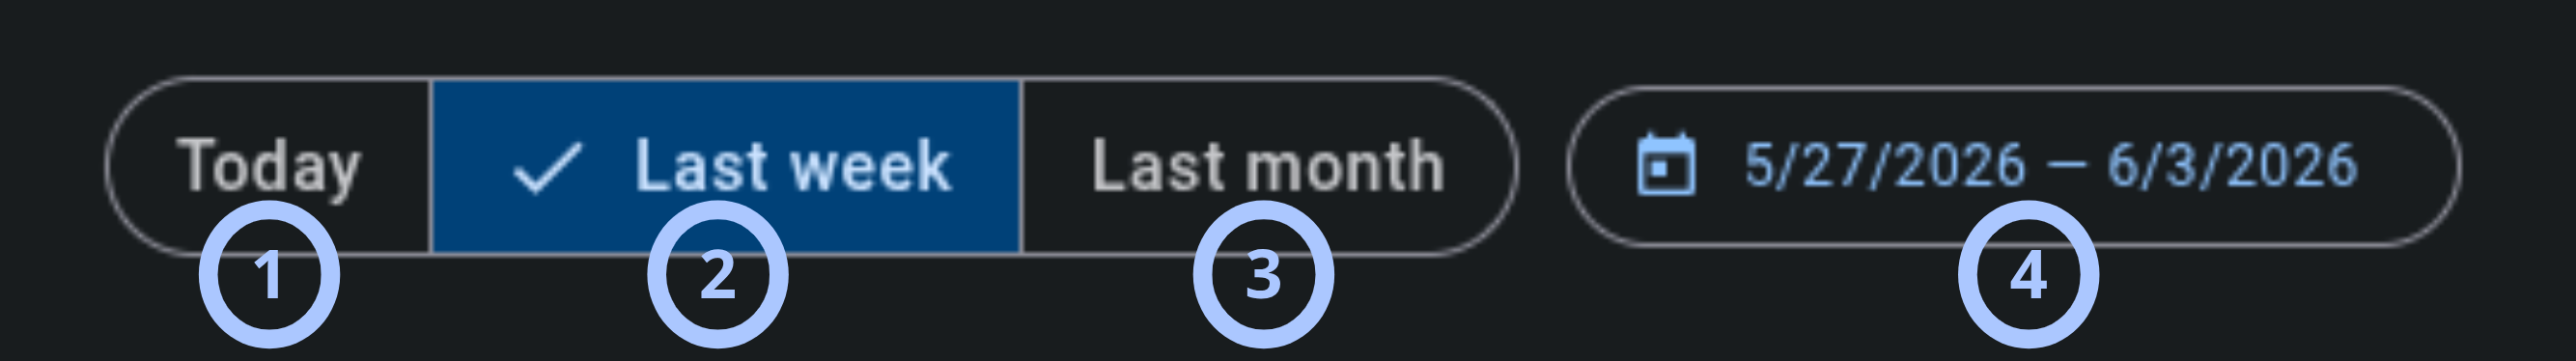
Time range selector
At the top of the page, select a time range that updates the charts.
| Callout | Name | Description |
|---|---|---|
| 1 | Today (button) | Sets the dashboard time range from 00:00 of the current day to the current time. Updates all dashboard widgets. |
| 2 | Last Week (button) | Sets the dashboard time range from 7 days ago to the current time. Updates all dashboard widgets. |
| 3 | Last Month (button) | Sets the dashboard time range from the same day in the previous month to the current time. Updates all dashboard widgets. |
| 4 | Calendar (date range selector) | Select a custom start and end date (by day). Updates all dashboard widgets. |
Widgets (charts)
Each widget is interactive and supports:
- Series toggles: select a legend item to show/hide a series.
- Hover details: hover over a chart area/point to see a tooltip with counts and time.
- Drill-down navigation: select a data point (or chart segment for radial charts) to open a relevant detail page with filters applied.
“Filters according to selected dot/section” means the destination page opens with filters pre-populated based on the clicked data point.
Events rate
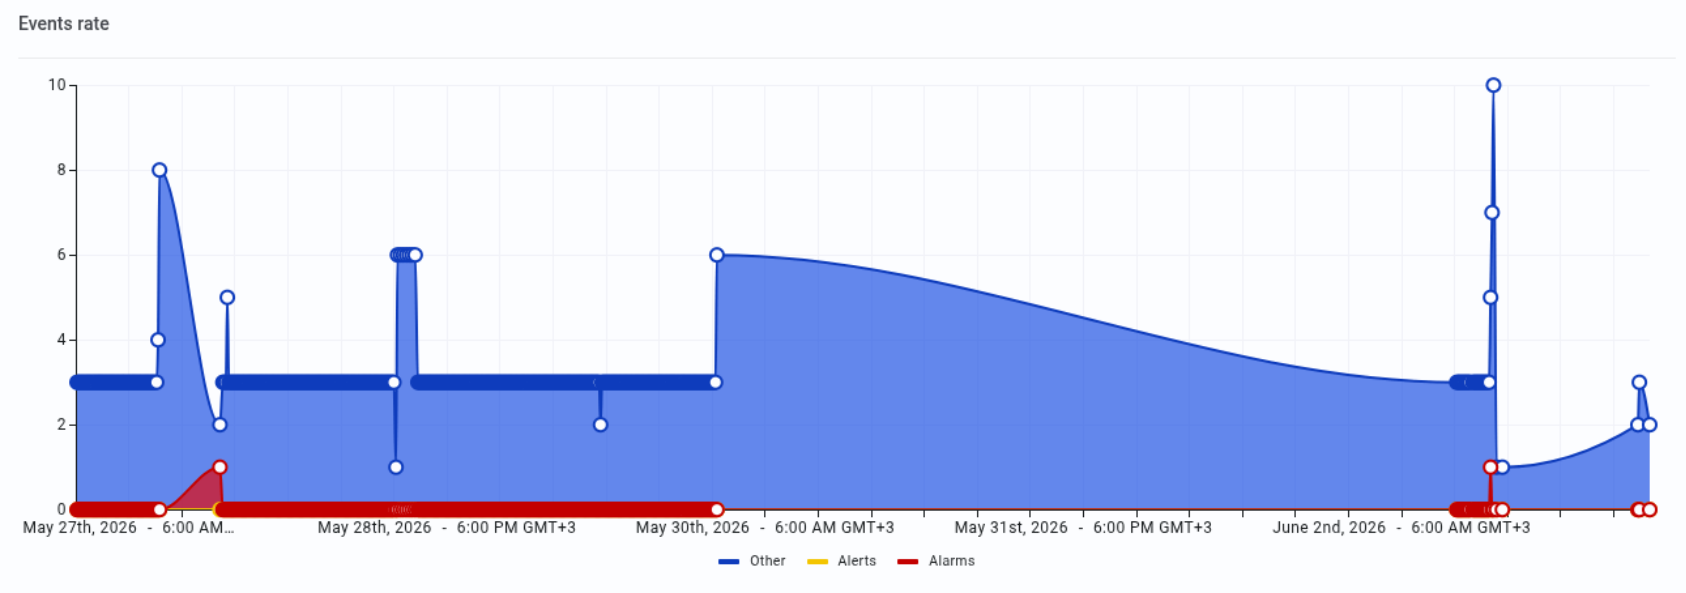
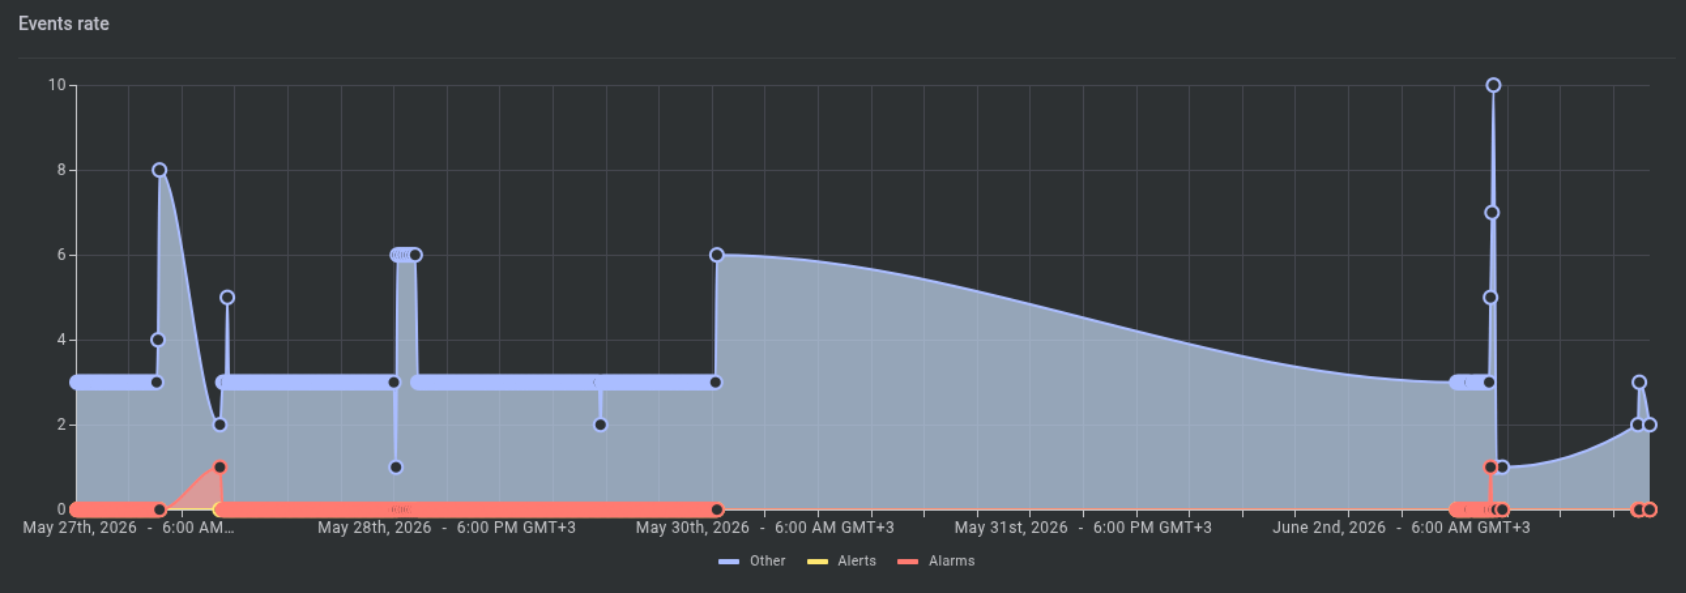
Purpose: Trend of events over time.
Chart type: Time series line/point chart
- The X-axis measures time and date, according with the interval set at the page top.
- The Y-axis measures the number of events.
Series:
- Alarm
- Alert
- Other
Interactions:
- Select a legend item (Alarm/Alert/Other) to enable/disable that series.
- Hover to view tooltip with date/time and count per event type.
- Select a point on the chart to open the Events page filtered to the selected context.
Alarmed & faulty equipment
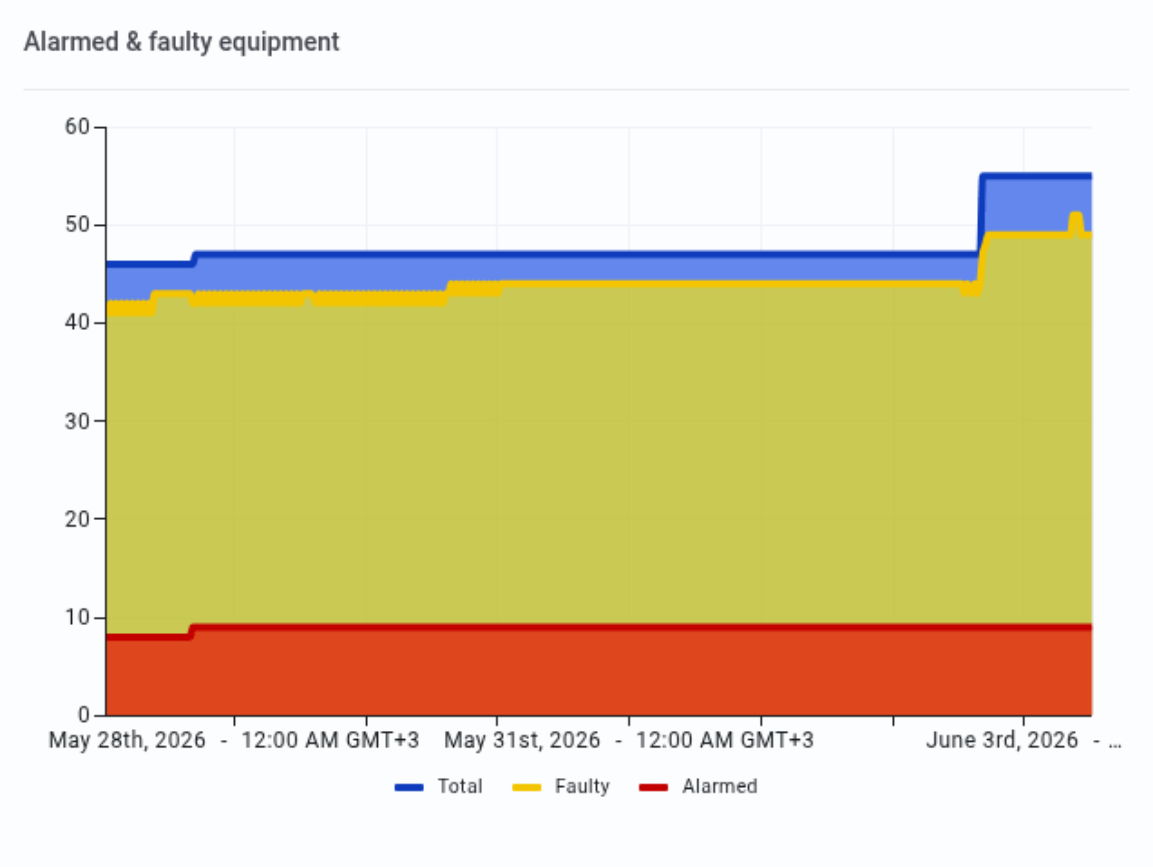
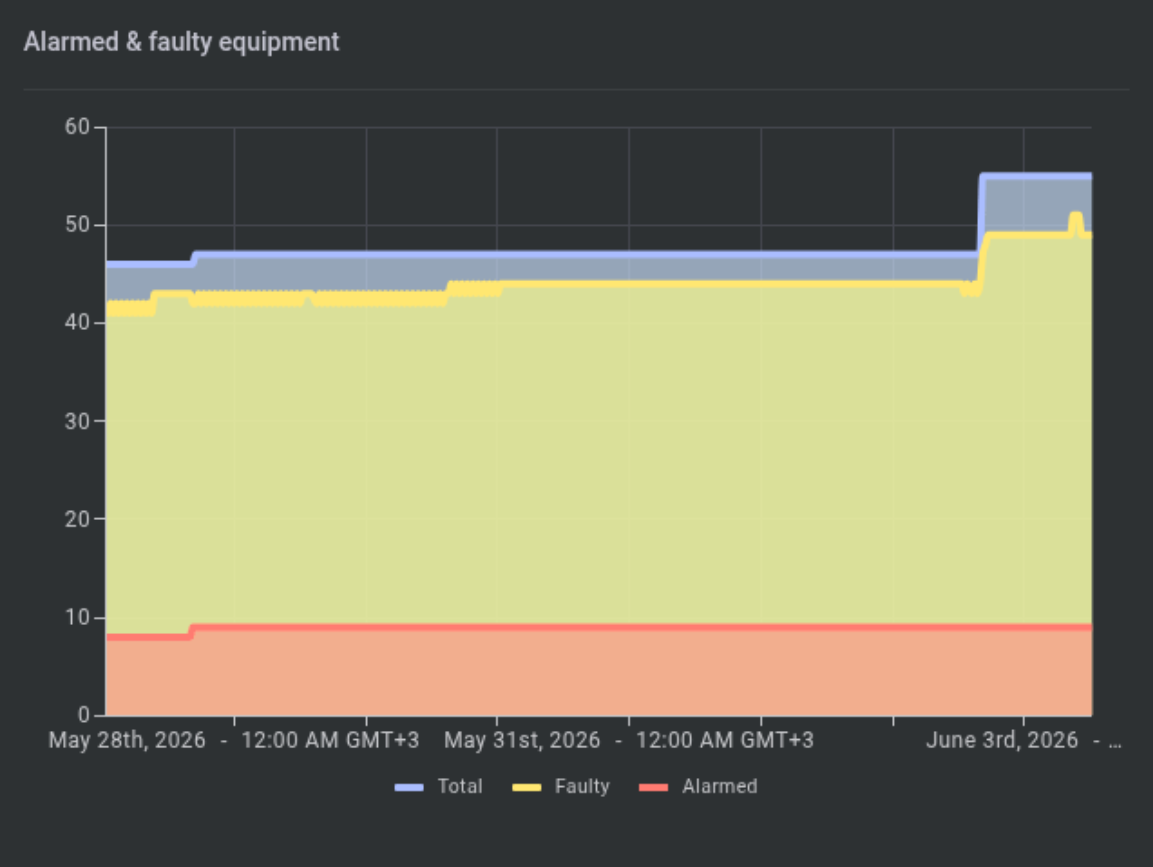
Purpose: Trend of equipment in specific states over time.
Chart type: Time series line/point chart
- The X-axis measures the date, according with the interval set at the page top.
- The Y-axis measures the number of equipment.
Series:
- Total
- Faulty
- Alarmed
Interactions:
- Select a legend item to show/hide a series.
- Hover to view tooltip with date/time and equipment counts by type.
- Select a point to open the Equipment page filtered to the selected context.
All processes
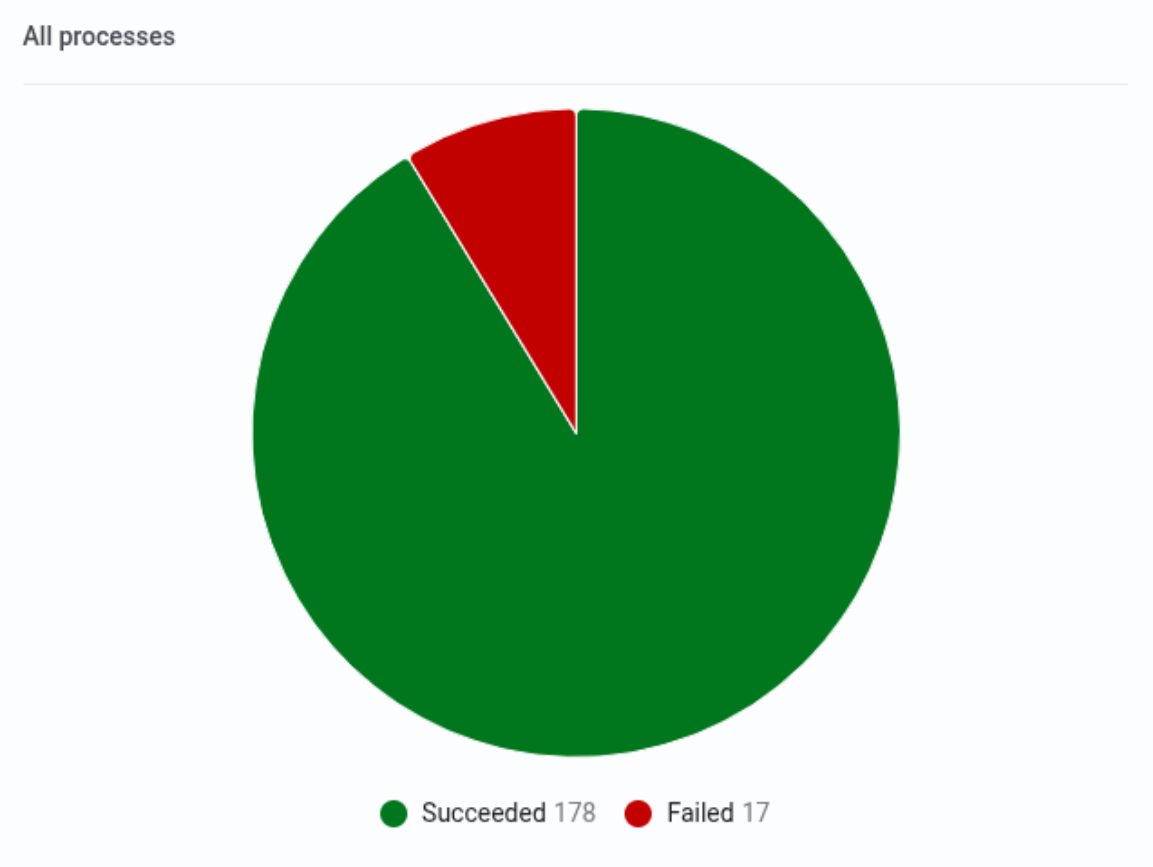
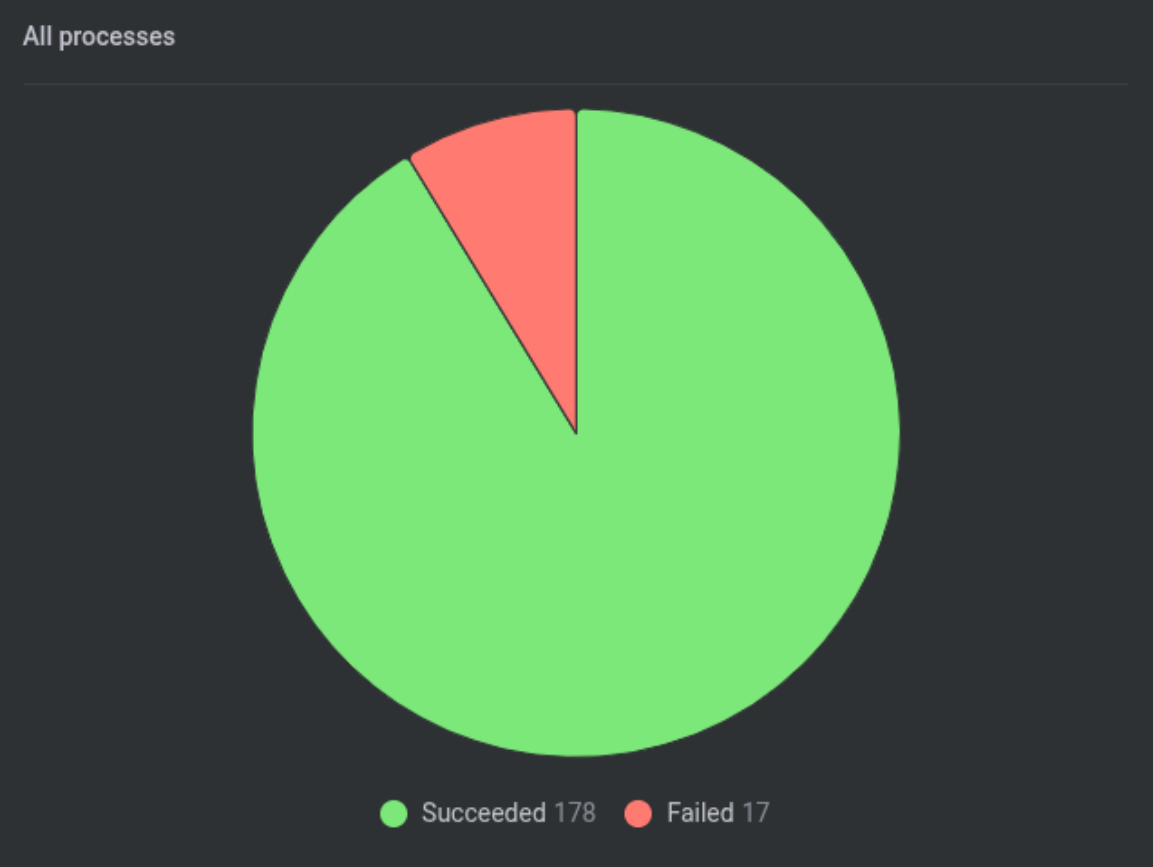
Purpose: Breakdown of process outcomes for the selected time range.
Chart type: Radial chart
Categories:
- Handled
- Started
- Failed
- Succeeded
Interactions:
- Select a category label to show/hide that category in the chart.
- Hover a segment to see the count for that process type.
- Select a segment to open the Processes page filtered to the selected status/type.
Online & connected equipment
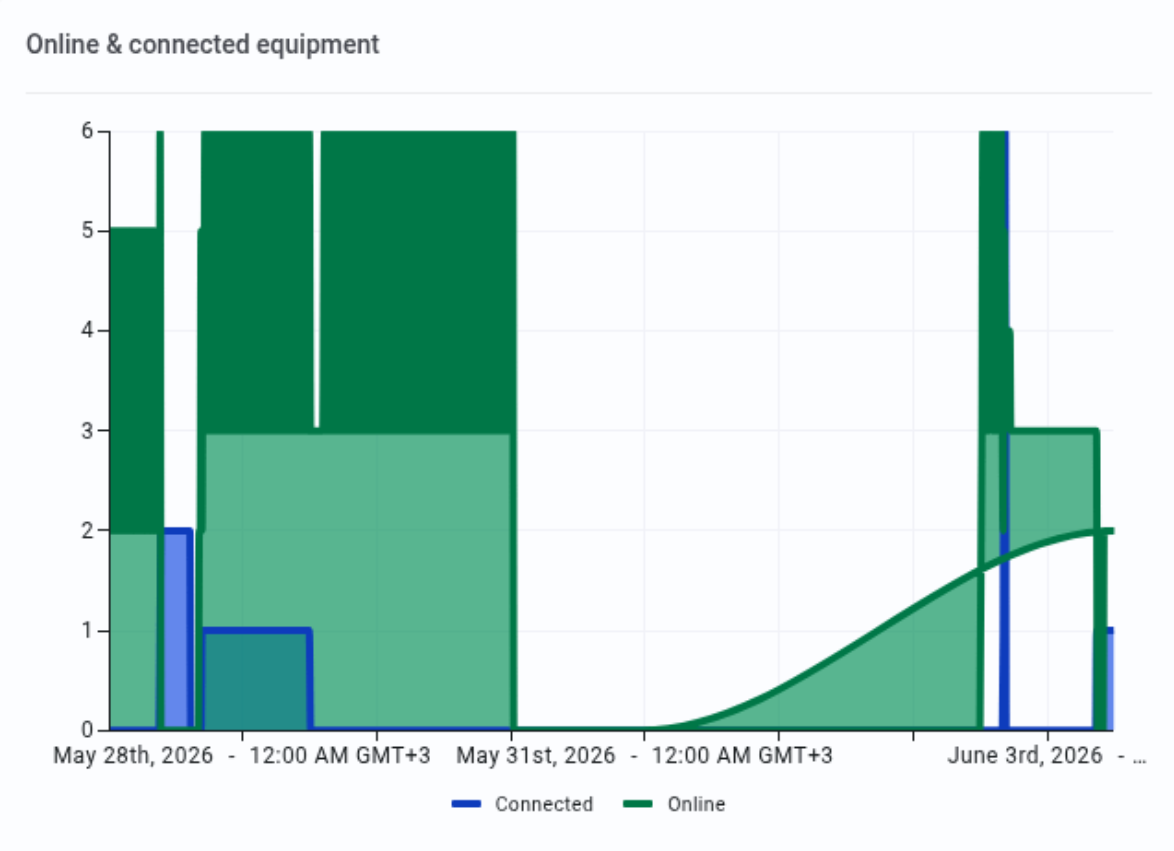
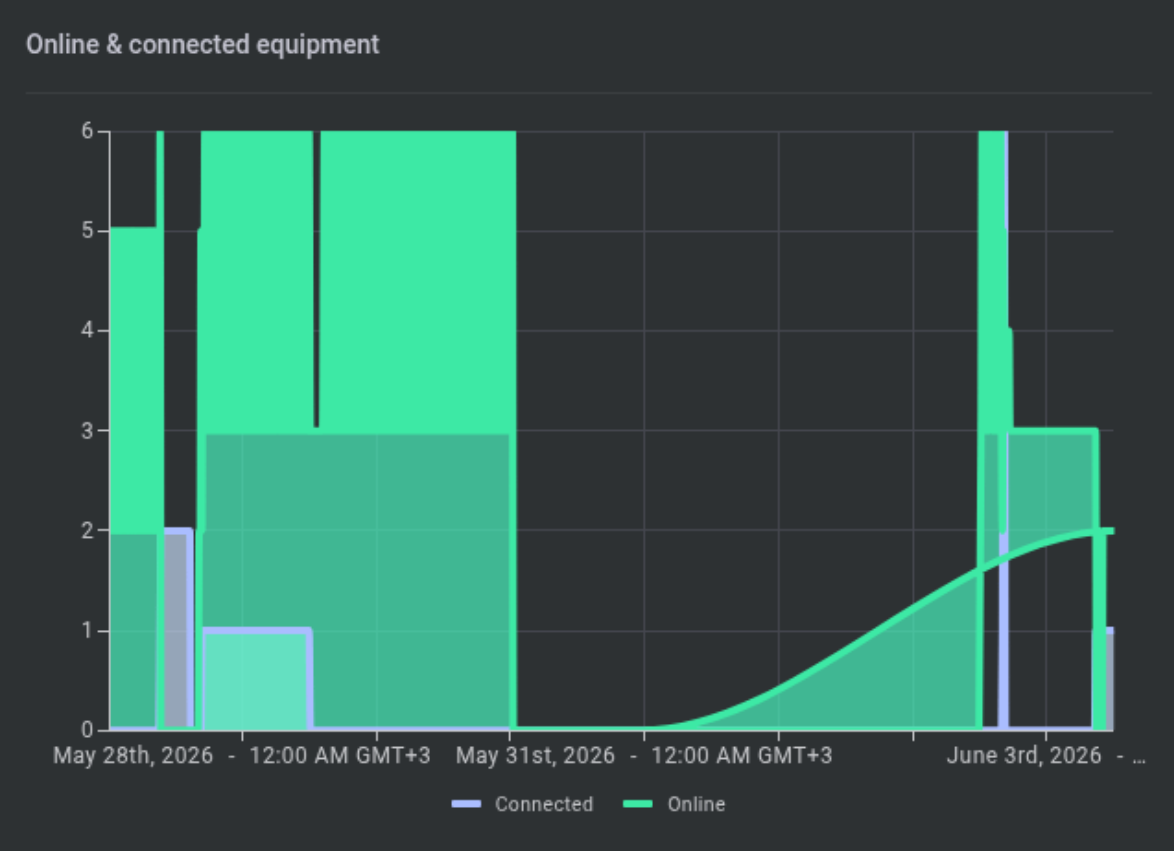
Purpose: Trend of connectivity and online supervision status.
Chart type: Time series line/point chart
- The X-axis measures the date, according with the interval set at the page top.
- The Y-axis measures the number of equipment.
Series:
- Connected
- Online
Interactions:
- Select a legend item to show/hide a series.
- Hover to view tooltip with date/time and counts by type.
- Select a point to open the Equipment page filtered to the selected connectivity/online state.
Connected accounts
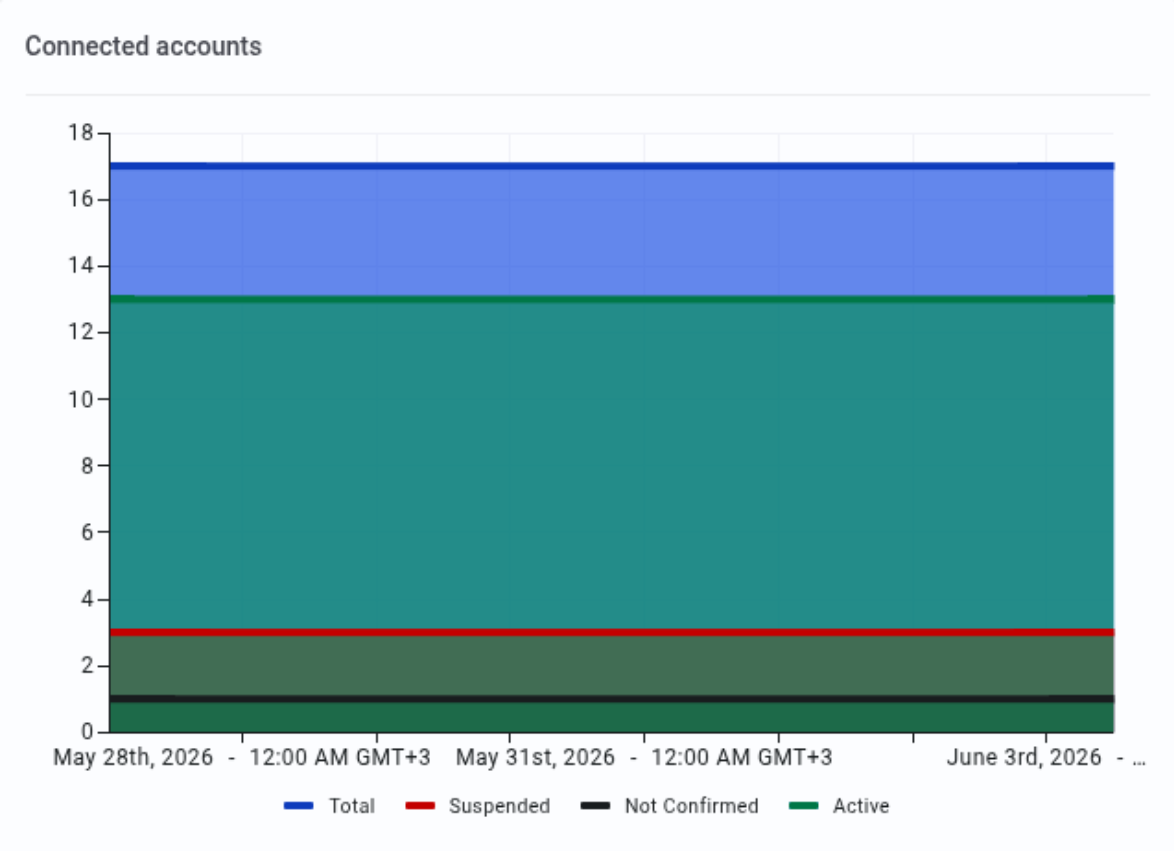
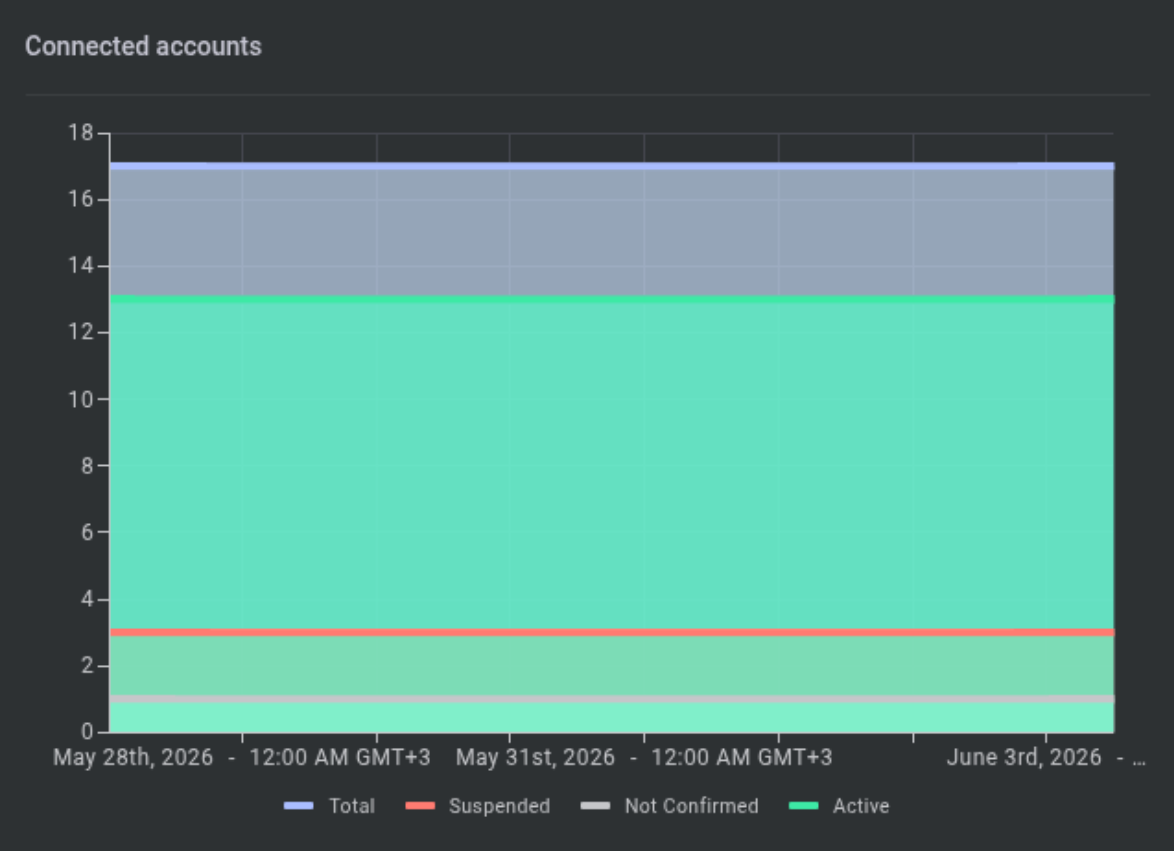
Purpose: Trend of account connectivity/verification states.
Chart type: Time series line/point chart
- The X-axis measures the date, according with the interval set at the page top.
- The Y-axis measures the number of accounts.
Series:
- Active
- Not Verified
- Suspended
- Total
Interactions:
- Select a legend item to show/hide a series.
- Hover to view tooltip with date/time and account counts by type.
- Select a point to open the Accounts page filtered to the selected context.
Billing statistics
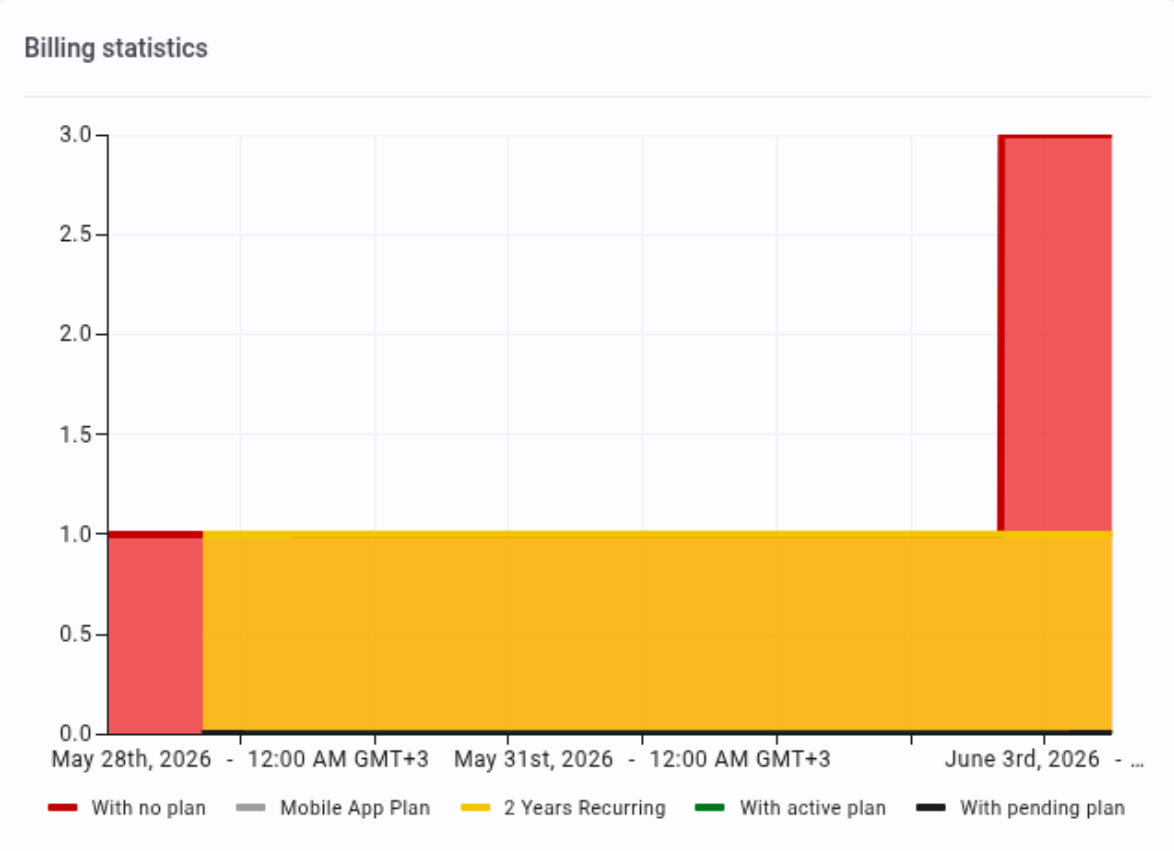
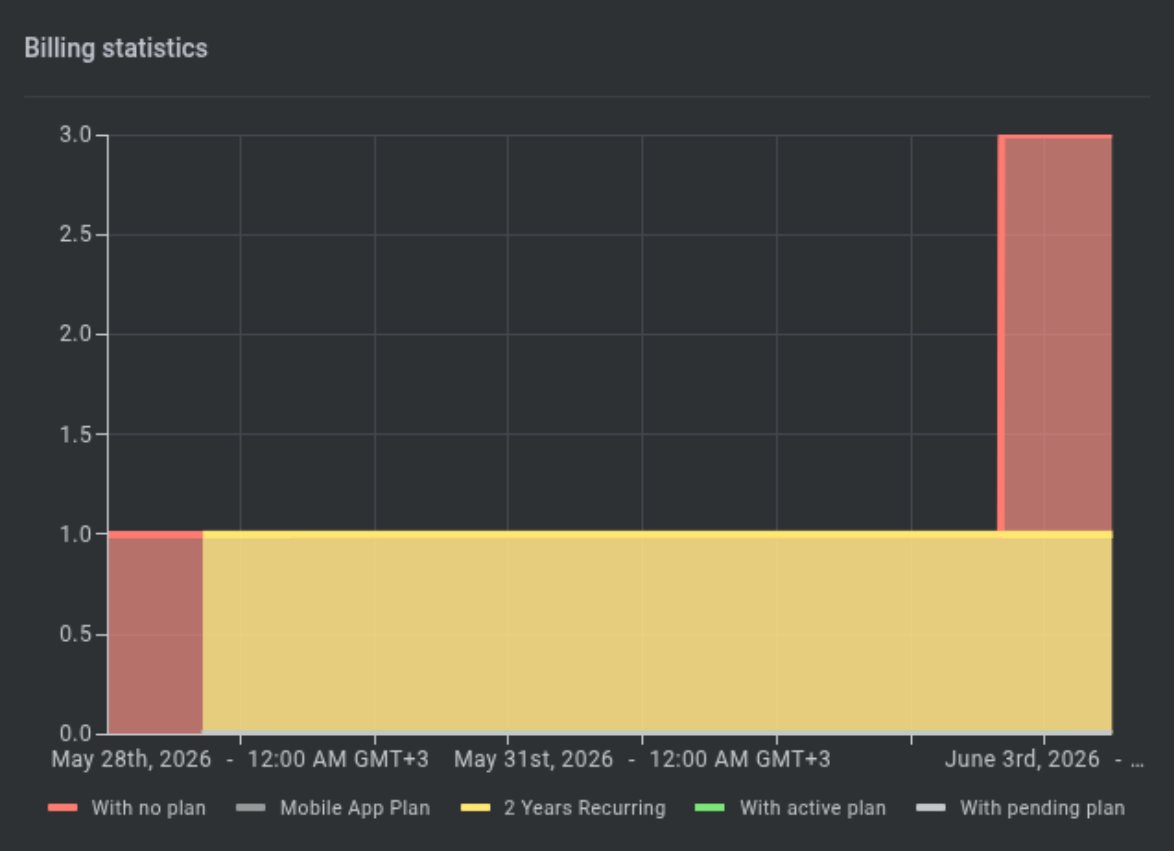
Purpose: Trend of billing plan coverage across equipment (when billing is enabled).
Chart type: Time series line/point chart
- The X-axis measures the date, according with the interval set at the page top
- The Y-axis measures the number of panels
Series:
- With no plan
- Mobile App Plan
- 1 Month Recurring
- 1 Year Recurring
- 2 Years Recurring
- 3 Years Recurring
- With active plan
- With pending plan
Interactions:
- Select a legend item to show/hide a series.
- Hover to view tooltip with date/time and equipment counts by plan state.
- Select a point to open the Equipment page filtered to the selected context.
How to use this page
Change the time range for all widgets
Goal: Update dashboard charts to a time period you want to analyze.
- At the top of the page, select one of the preset buttons:
- Today
- Last Week
- Last Month
- Optional: Use the Calendar control to select a custom date range by day.
Expected result: All widgets refresh to show data for the selected time range.
Focus on one data series (show/hide a series)
Goal: Reduce chart noise by hiding series you do not need.
- In a widget, find the legend beneath (or above) the chart.
- Select a series name (for example, Alarm or Faulty) to toggle it off.
- Select it again to toggle it back on.
Expected result: The chart redraws to show only the enabled series.
Investigate a spike by drilling down from a chart point
Goal: Open the detailed list page filtered to what you selected on the chart.
- Locate the relevant widget (for example, Events Rate).
- Hover over the chart to identify the time point with the spike.
- Select the dot/point at that time.
Expected result: The system opens the relevant detail page.
The destination page should have filters applied based on the selected point.
If you do not have permission to view the destination page or filtered items, you may see fewer results or be blocked from access.
Review billing coverage
Goal: Check how many equipment items have active or pending billing plans.
- If the Billing statistics widget is visible, review counts over time.
- To investigate a time point, select a dot for With Active plan or With Pending plan.
Expected result: The Equipment page opens filtered to the selected billing plan state.
If billing is not enabled, this widget will not appear.
Field and option reference
Time range controls
| Name | Description | Accepted values | Behavior | Restrictions | Default |
|---|---|---|---|---|---|
| Today | Sets the dashboard time range from 00:00 of the current day to the current time. | Preset | Refreshes all widgets using data for the current day. | None specified. | Not specified. |
| Last Week | Sets the dashboard time range from 7 days ago to the current time. | Preset | Refreshes all widgets using data for the last 7 days. | None specified. | Not specified. |
| Last Month | Sets the dashboard time range from the same day in the previous month to the current time. | Preset | Refreshes all widgets using data from the same day in the previous month up to the current time. | None specified. | Not specified. |
| Calendar | Select a custom time range by day. | Date range | Refreshes all widgets to selected days. | None specified. | Not specified. |
Common chart controls (all widgets)
| Name | Description | Accepted values | Behavior | Restrictions | Default |
|---|---|---|---|---|---|
| Legend series toggle | Show or hide a data series/category. | On/Off per series | Updates chart display without changing data. | Not available for tooltips; only affects visibility. | All series shown. |
| Tooltip (hover) | Displays details for a point/segment. | N/A | Shows time + counts for the hovered element. | Hover behavior on touch devices not specified. | N/A |
| Drill-down (select point/segment) | Opens a detail page with filters. | N/A | Navigates to Events/Equipment/Processes/Accounts with context filters. | Requires access to destination page. | N/A |
Tips
- Use Last Week to identify day-to-day patterns and recurring spikes.
- Hide Total in charts when you need to compare categories (for example, compare Faulty vs Alarmed without the total dominating the scale).
- When a spike occurs, drill down from the point and then refine filters further on the destination page.
Troubleshooting
The dashboard looks empty
Possible causes
- No data exists for the selected time range.
- Your visibility permissions exclude the entities that would populate the dashboard.
What to do
- Select a broader time range (for example, Last Month).
- Confirm you have permissions to access the related page/widgets.
- If the issue persists, contact your administrator to validate your access scope.
Selecting a chart point does not navigate
Possible causes
- Pop-up blocker or navigation blocked by the browser.
- You do not have permission to access the destination page.
What to do
- Try selecting a different point.
- Open the destination page directly (Events/Equipment/Processes/Accounts) to verify access.
Billing statistics widget is missing
Possible causes
- Billing is not enabled in license.
- You do not have permission to view Billing statistics information.
What to do
- Confirm whether billing is enabled.
- Ask an administrator to confirm permission to view Billing statistics for your role.