Diagnostic
Overview
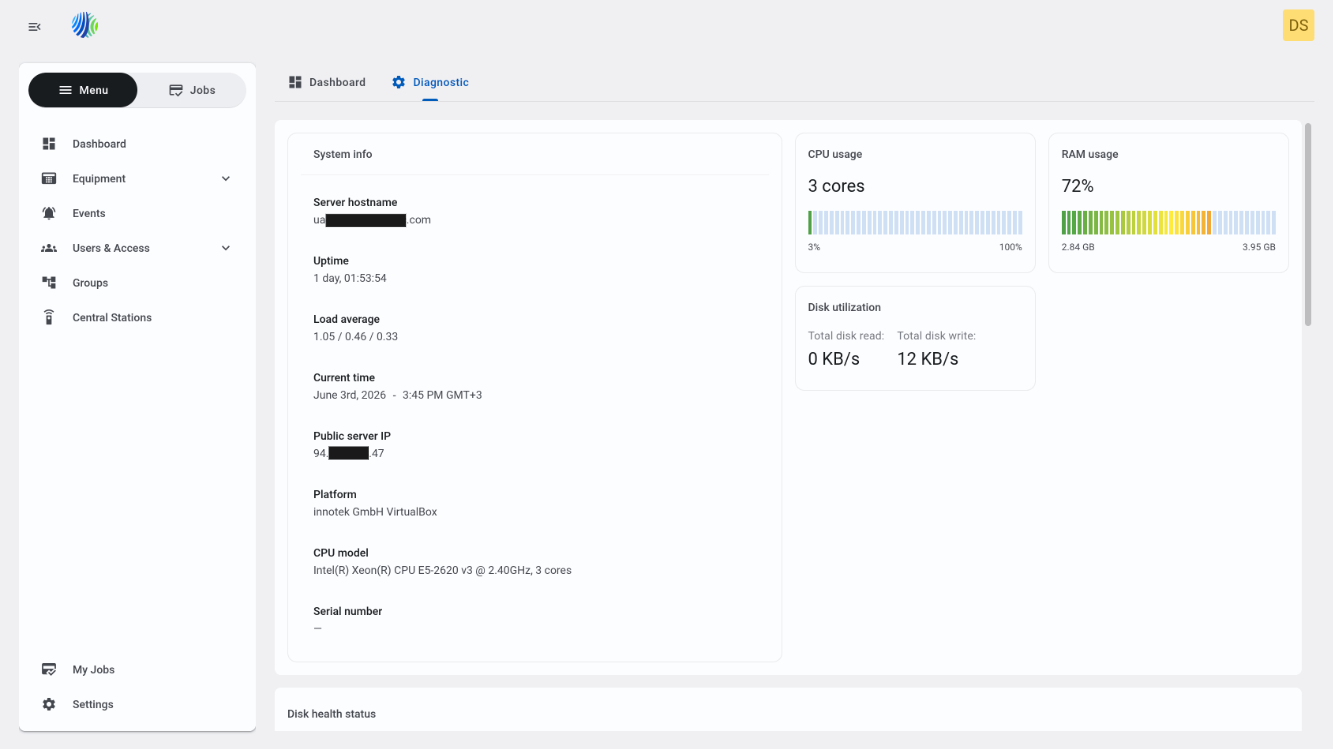
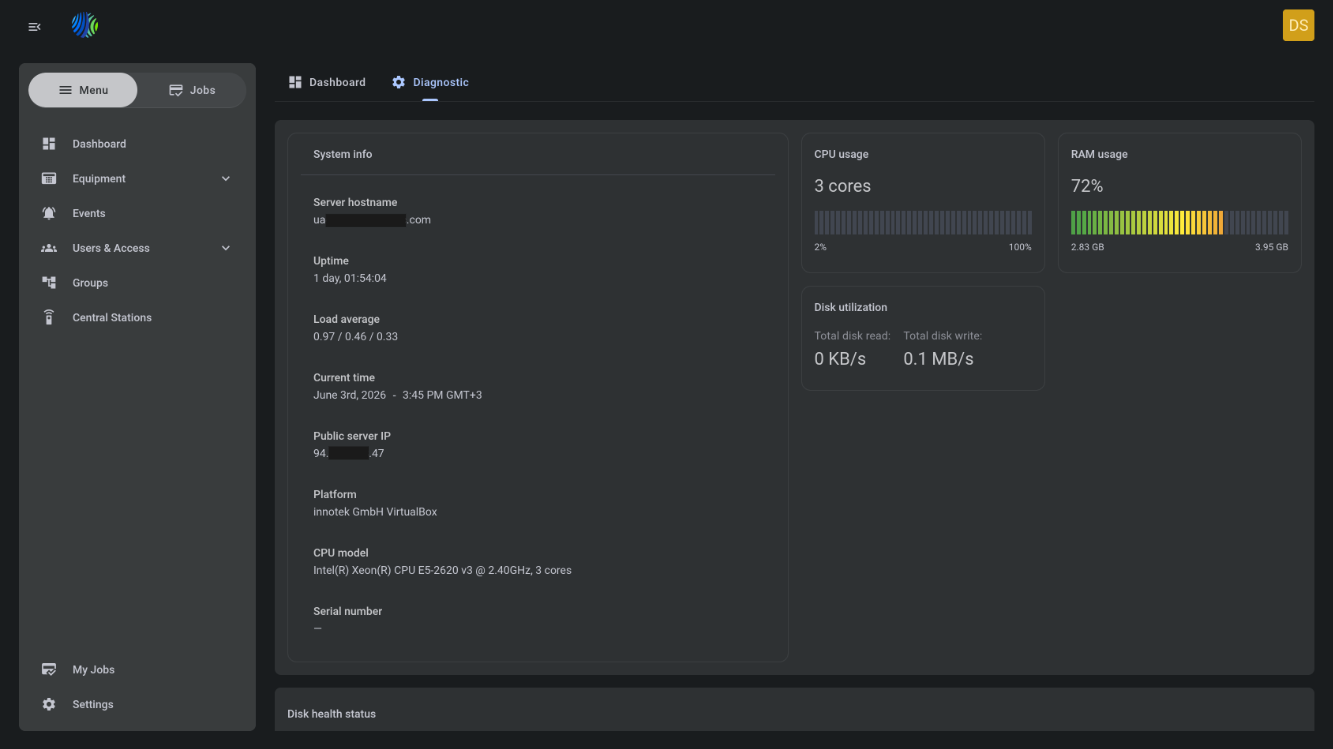
The Diagnostic page shows current health and runtime information for the PowerManage server. Use this page to review server status, check resource usage, inspect disk and service health, and run basic network diagnostic commands from the PowerManage UI.
Use the Diagnostic page when you need to:
- Check whether the PowerManage server is running within expected CPU, RAM, disk, and service limits.
- Collect server information for support or troubleshooting.
- Review disk health and file system usage.
- Verify DNS resolution, ICMP connectivity, route path, or repository connectivity from the server.
- Copy or save diagnostic output for an incident, support case, or maintenance record.
The page helps users and support engineers access health information without using Prometheus, SNMP tools, or direct server shell access.
Before you begin
Required permissions
- You must have permission to open the Dashboard page.
- You must have permission to open the Diagnostic page.
Access to the Diagnostic page and diagnostic data is controlled by role group permissions named "Diagnostic Info".
Preconditions
- Your user account must be active.
- The PowerManage server must be reachable from your browser.
- Diagnostic services on the server must be running and able to collect system information.
- To open the page, go to Dashboard, then select Diagnostic at the top of the page.
Dependencies
- System information depends on the operating system and hardware or virtualization platform.
- Public server IP detection depends on network configuration and external connectivity.
- Disk health status depends on the disks and health information reported by the server.
- DNS, ICMP, traceroute, and repository connectivity checks depend on server network access, routing rules, DNS configuration, TLS trust, and firewall policy.
Important limitations
- The Diagnostic page shows server-side results. Network checks run from the PowerManage server, not from your workstation.
- Values such as CPU usage, RAM usage, disk read/write rate, and service status can change while you view the page.
- A successful network check does not confirm that all application traffic is allowed. It only confirms the selected diagnostic action.
- ICMP checks may fail if ping traffic is blocked by a firewall, even when the destination service is available.
- Disk health status depends on the health data available to the server. Virtual disks may report limited hardware details.
- The page is for review and troubleshooting. It does not provide controls to repair disks, restart services, change network settings, or modify server configuration.
Page layout
The Diagnostic page is organized into widgets. Each widget focuses on one server health area or diagnostic workflow.
System info widget
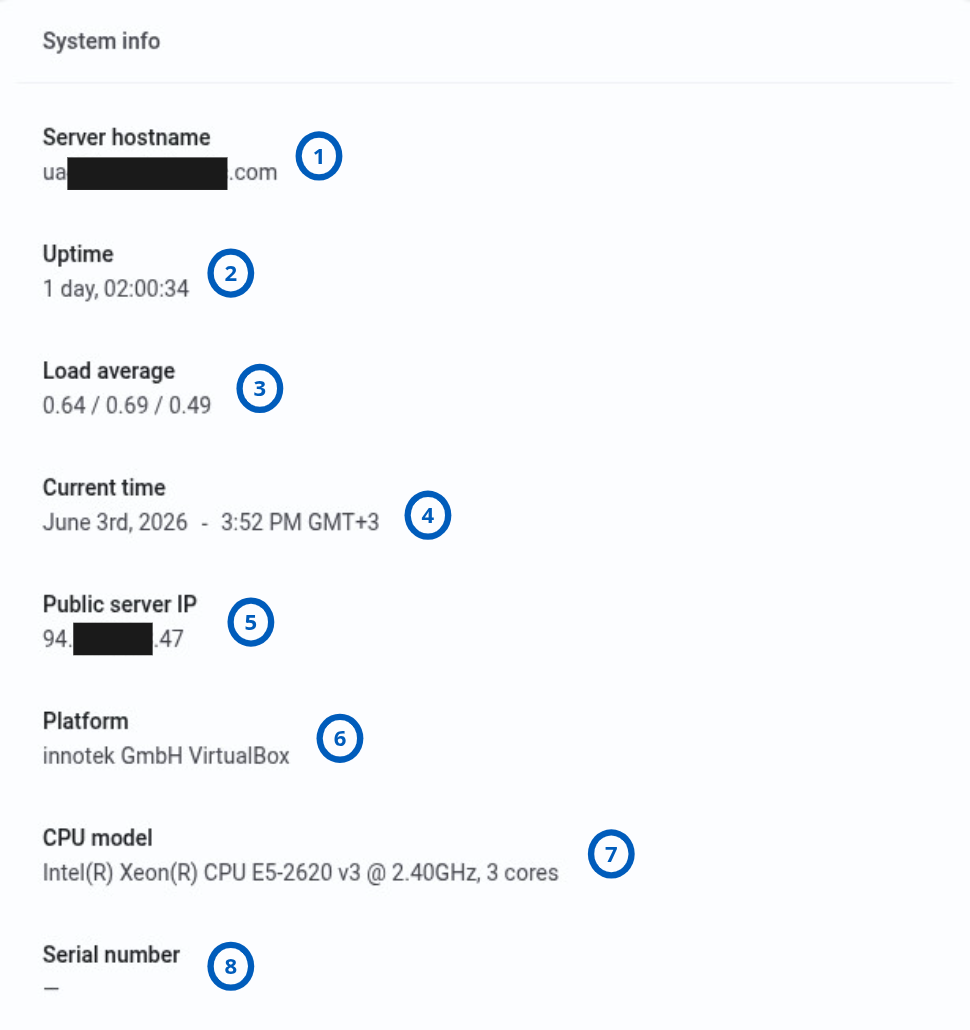
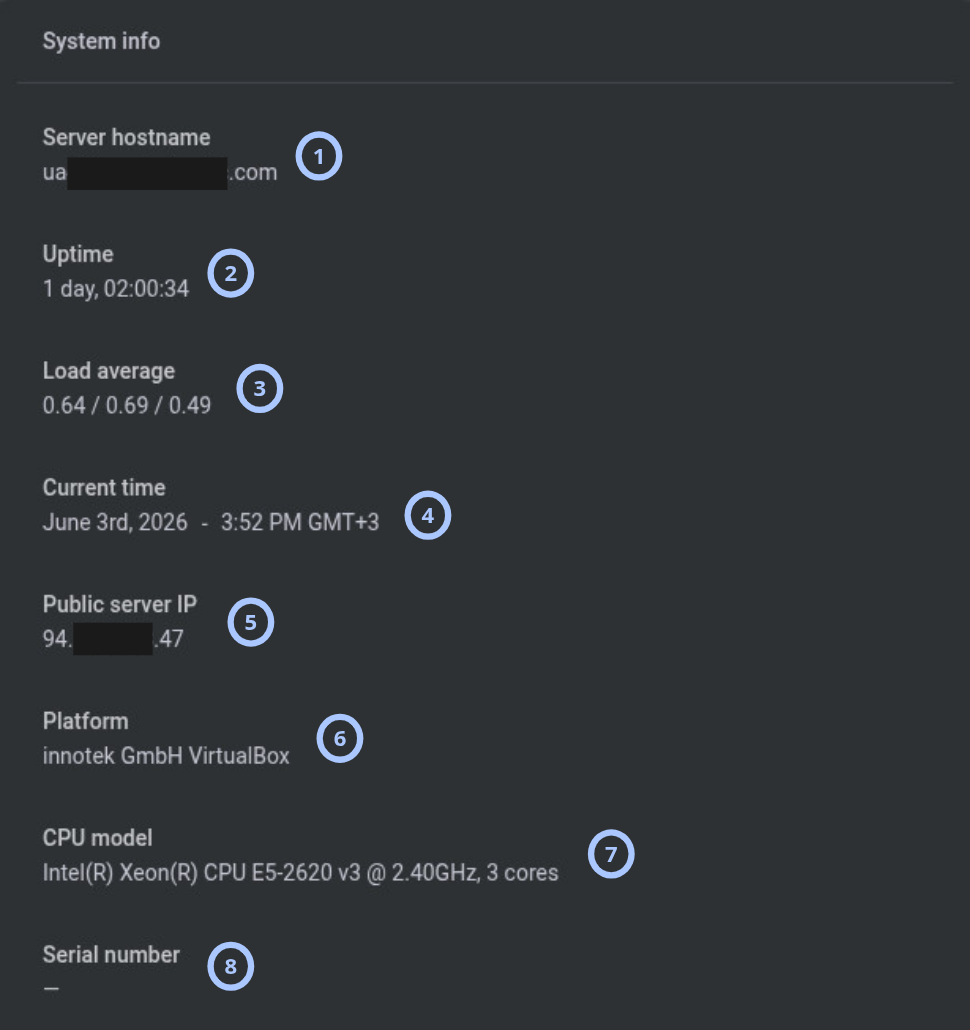
The System info widget shows general server identity, runtime, hardware, platform, and time information. Use it to confirm which server you are reviewing and to collect baseline information for troubleshooting.
| Callout | UI element | Description | When to use |
|---|---|---|---|
| 1 | Server hostname | Shows the server hostname. | Use to confirm that you are reviewing the expected PowerManage server. |
| 2 | Uptime | Shows how long the server has been running, for example 1 day, 00:07:14. | Use to identify recent restarts or confirm continuous operation. |
| 3 | Load average | Shows the server load average, for example 0.32 / 0.3 / 0.33. | Use to review recent CPU scheduling pressure and compare it with CPU capacity. |
| 4 | Current time | Shows the current server time, for example June 3rd, 2026 - 1:59 PM GMT+3. | Use to confirm the server time zone and compare timestamps during troubleshooting. |
| 5 | Public server IP | Shows the public IP address detected for the server. | Use when you need to confirm the external address used by the server. |
| 6 | Platform | Shows the server platform, for example innotek GmbH VirtualBox. | Use to identify whether the server is physical or virtualized. |
| 7 | CPU model | Shows the CPU model and core count, for example Intel(R) Xeon(R) CPU E5-2620 v3 @ 2.40GHz, 3 cores. | Use to document compute capacity or compare usage with available cores. |
| 8 | Serial number | Shows the server serial number when available. | Use for asset tracking or support identification. |
CPU usage widget
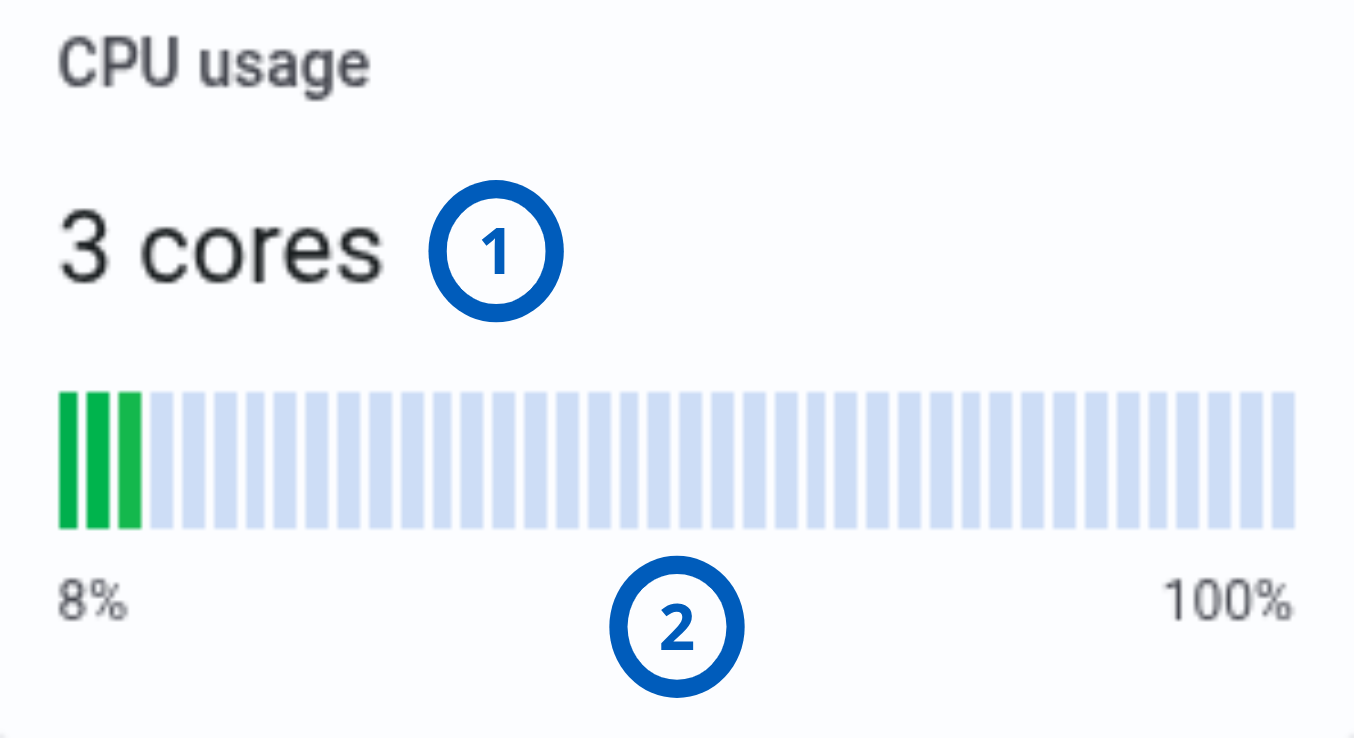
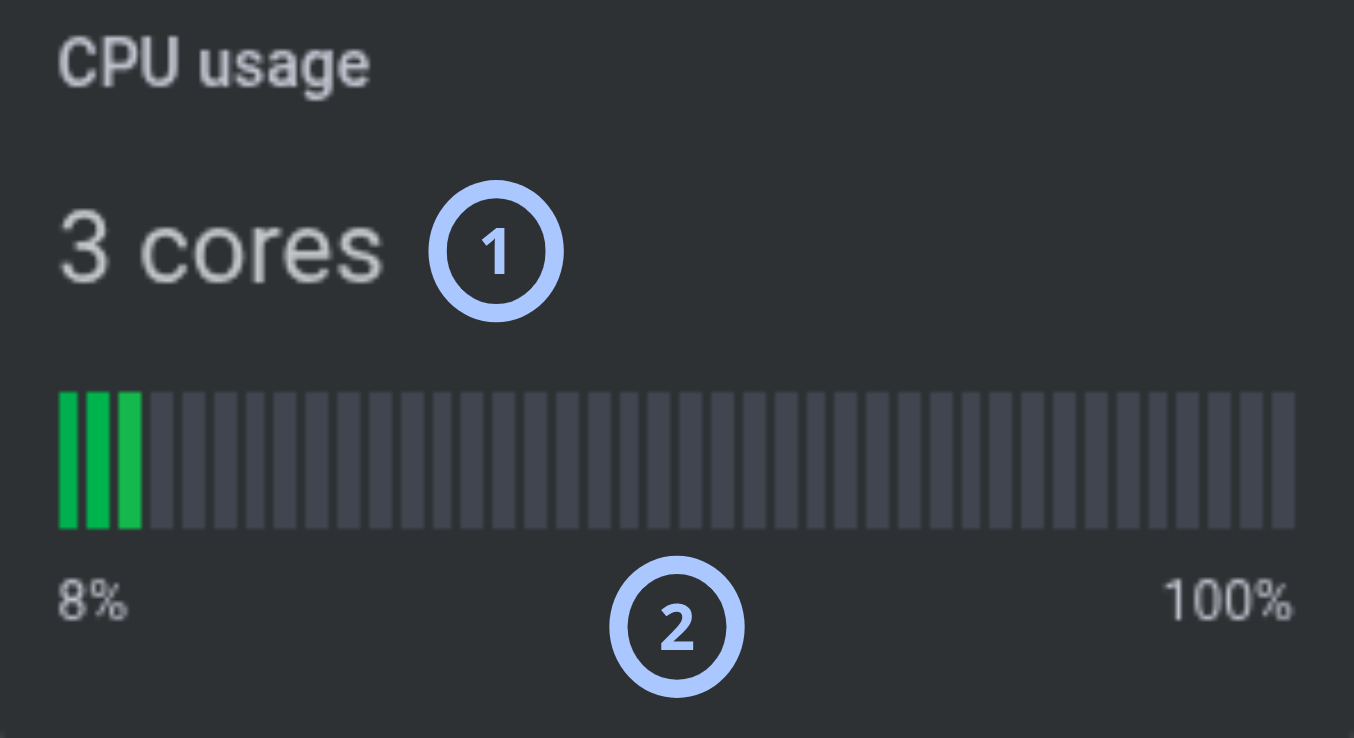
The CPU usage widget shows the number of CPU cores and current CPU usage as a percentage. Use it to identify high CPU usage and determine whether server load may affect application performance.
| Callout | UI element | Description | When to use |
|---|---|---|---|
| 1 | Cores count | Shows the total number of CPU cores available to the server. | Use to understand server capacity before evaluating usage levels. |
| 2 | Usage bar | Shows current CPU usage. The left side shows the current percentage. The right side represents the maximum value, 100%. | Use to check whether CPU usage is normal, elevated, or near maximum. |
RAM usage widget
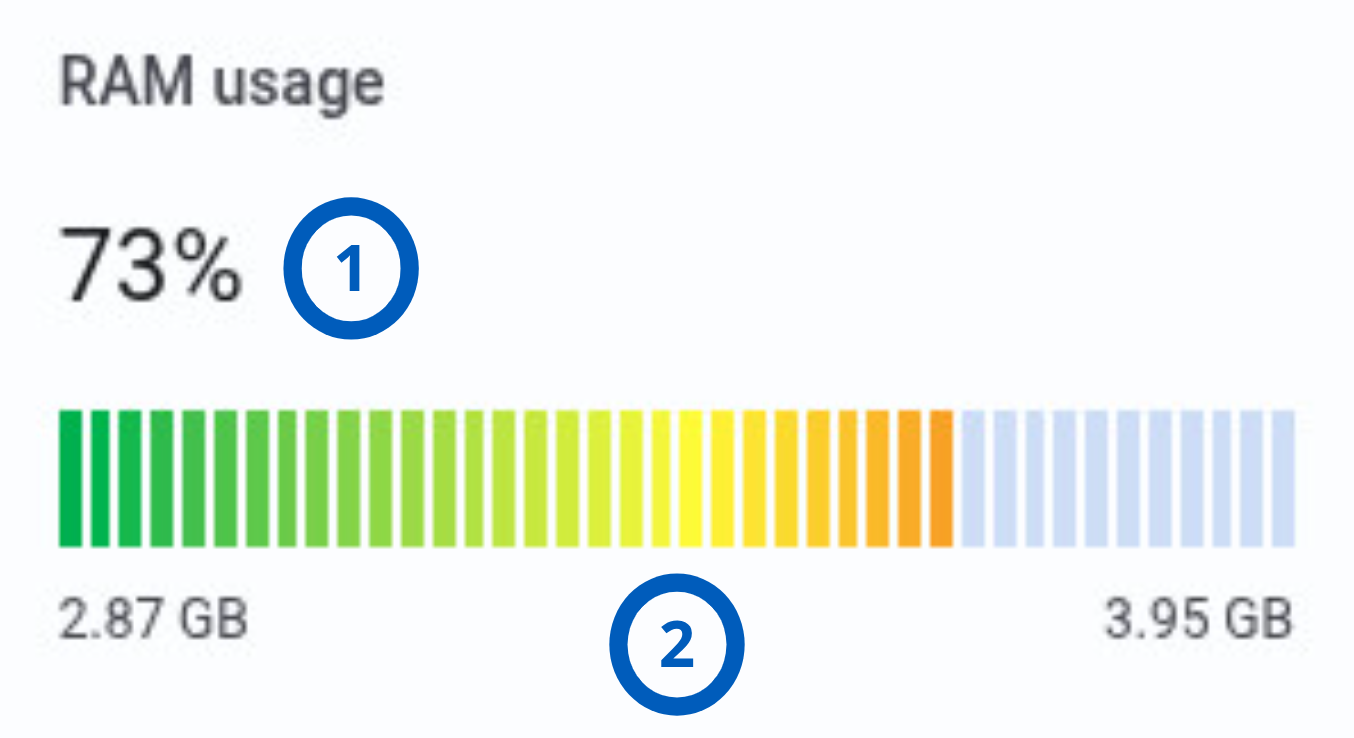
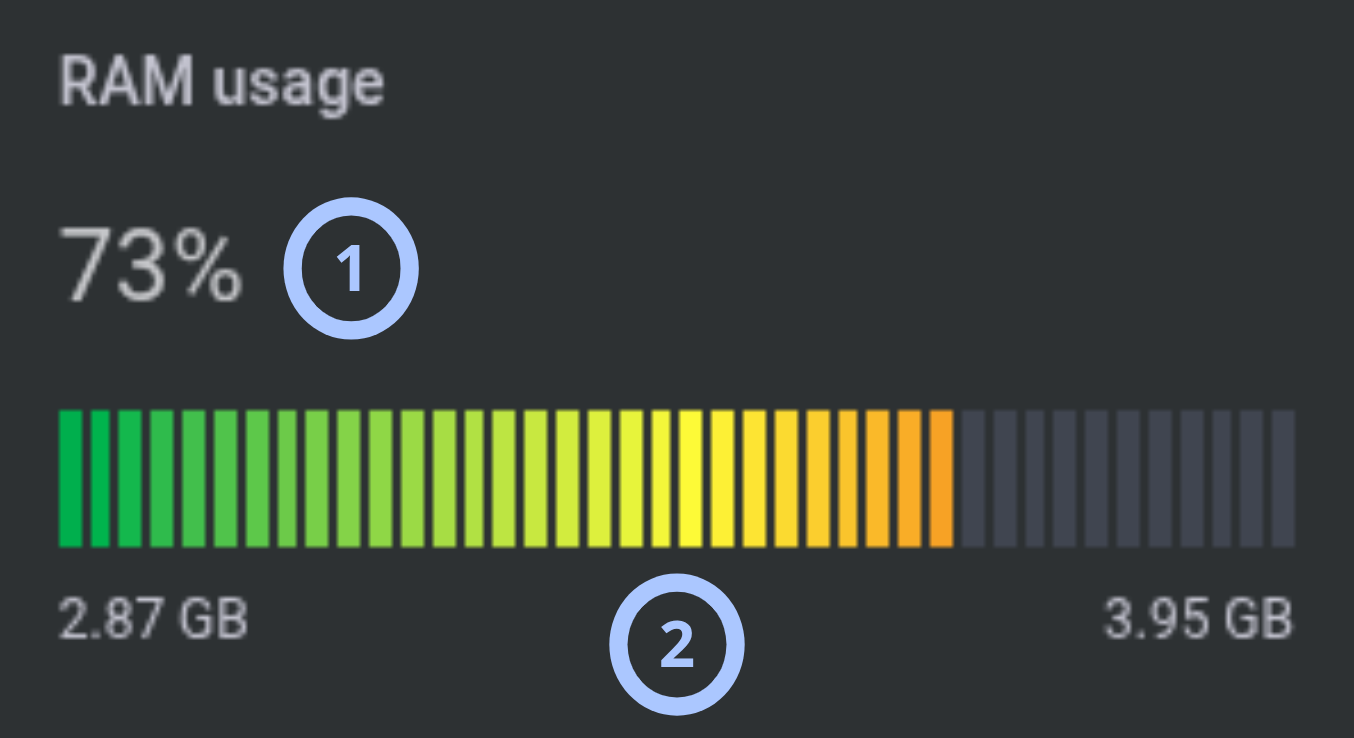
The RAM usage widget shows current memory usage as a percentage and as used memory compared with total memory. Use it to check whether the server has enough available memory.
| Callout | UI element | Description | When to use |
|---|---|---|---|
| 1 | RAM usage percentage | Shows total RAM usage as a percentage. | Use to quickly assess current memory pressure. |
| 2 | Usage bar | Shows used RAM on the left and total RAM on the right, in GB. | Use to compare current memory use with total available memory. |
Disk utilization widget
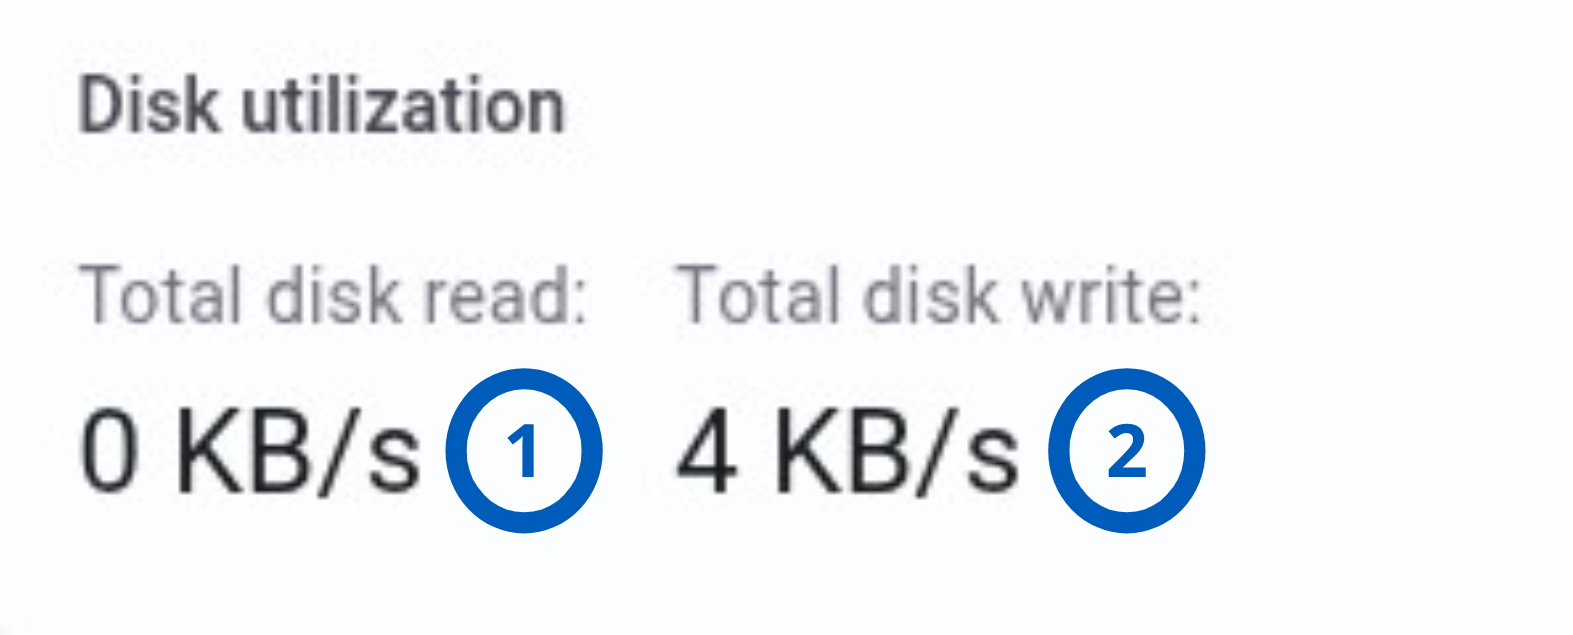
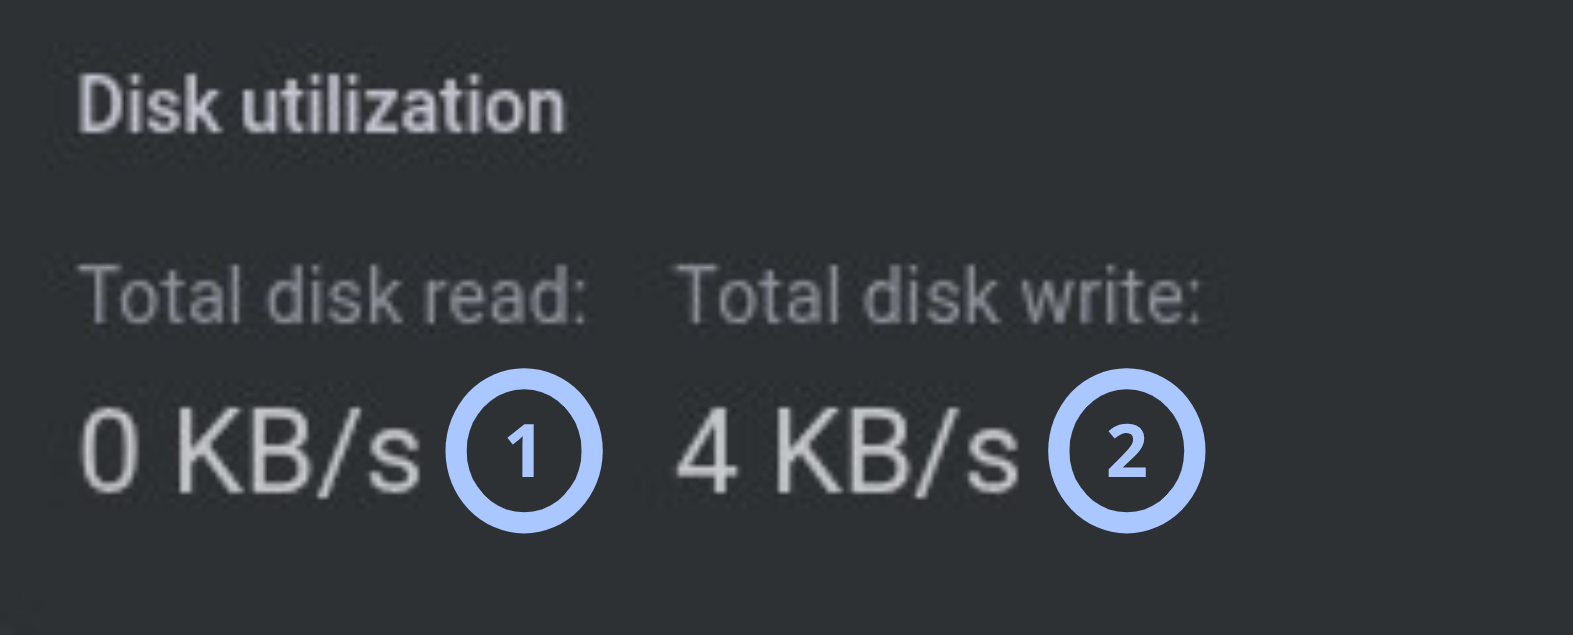
The Disk utilization widget shows current aggregate disk read and write throughput. Use it to detect high disk activity that may affect performance.
| Callout | UI element | Description | When to use |
|---|---|---|---|
| 1 | Total disk read | Shows total disk read throughput per second. | Use to check whether the server is reading large amounts of data from disk. |
| 2 | Total disk write | Shows total disk write throughput per second. | Use to check whether the server is writing large amounts of data to disk. |
Disk health status widget
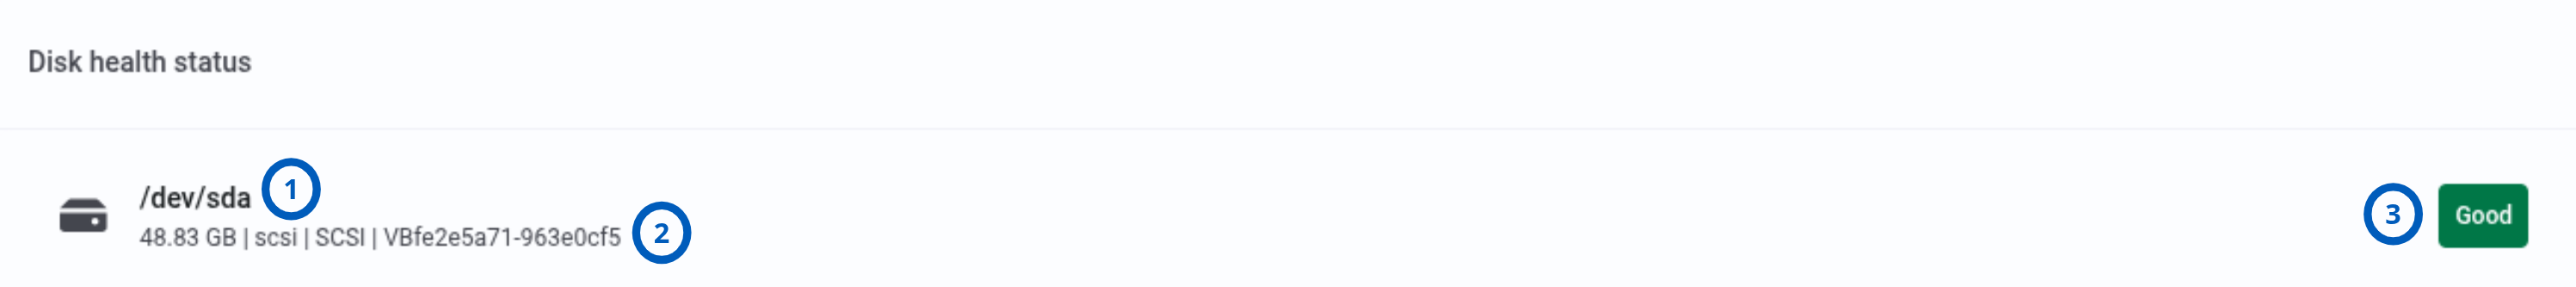
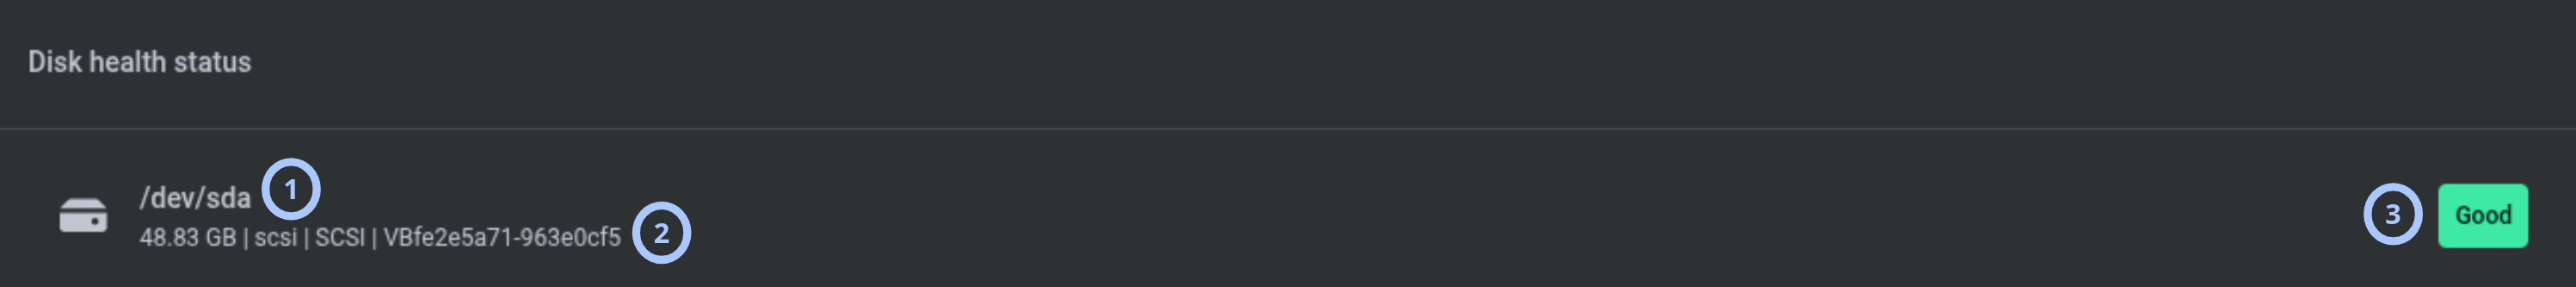
The Disk health status widget lists installed disks and shows a health status icon for each disk. Use it to identify disks that require investigation.
| Callout | UI element | Description | When to use |
|---|---|---|---|
| 1 | Disk name | Shows the disk device name, for example /dev/sda. | Use to identify the disk referenced by health information. |
| 2 | Disk details | Shows disk size, bus type, model/type, and identifier, for example 48.83 GB | scsi | SCSI | VBfe2e5a71-963e0cf5. | Use to distinguish disks when more than one disk is installed. |
| 3 | Health status icon | Shows disk status. Good uses a green icon. Fail uses a red icon. | Use to quickly identify disks that may need support review or replacement. |
A red Fail status indicates that the disk should be investigated. Follow your organization’s backup and maintenance procedures before making changes to storage.
Disk file system widget
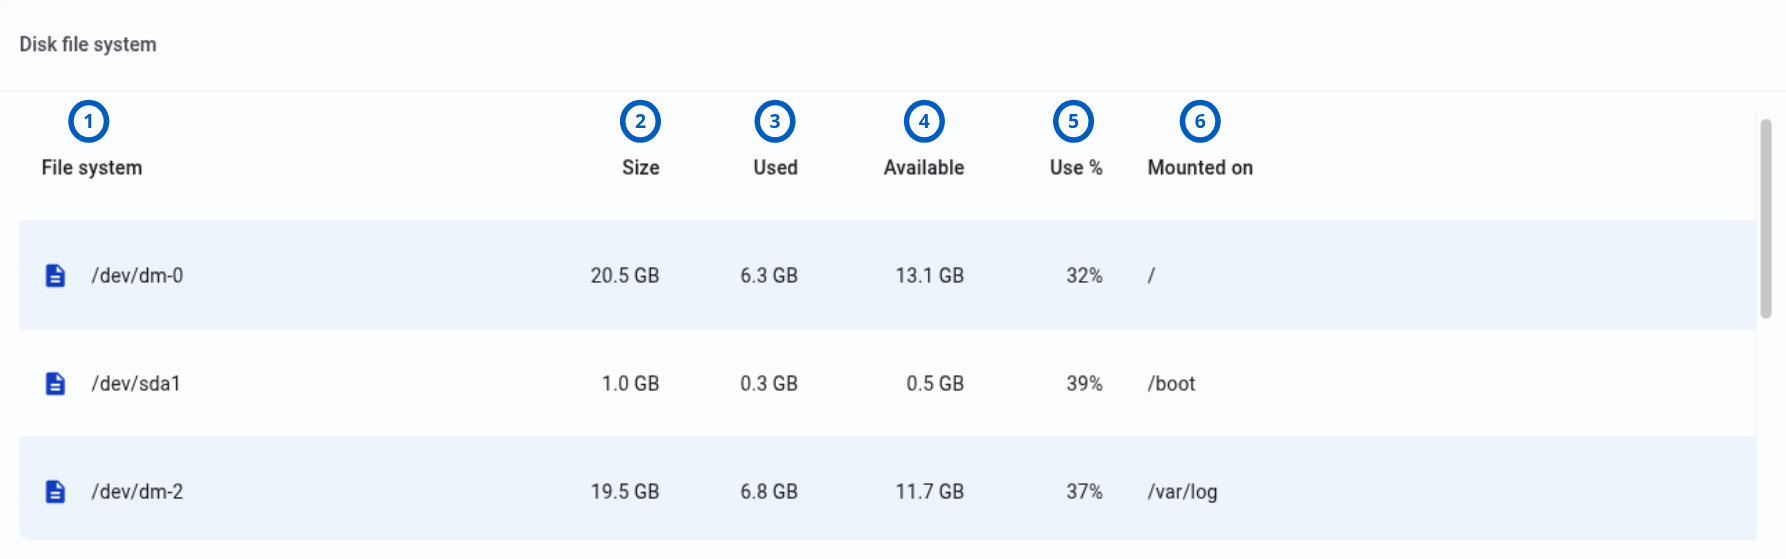
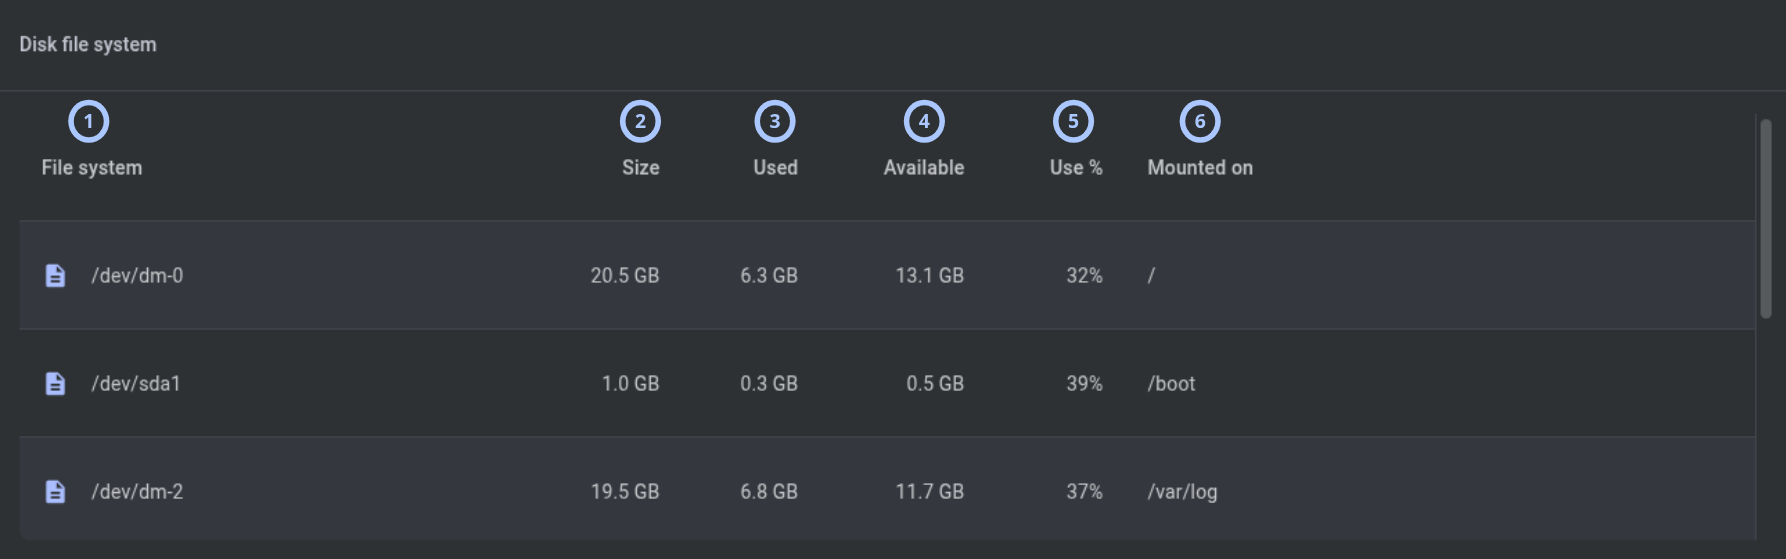
The Disk file system widget shows a grid of file systems and partitions on the server. Use it to identify low disk space or confirm where partitions are mounted.
| Callout | UI element | Description | When to use |
|---|---|---|---|
| 1 | File system column | Shows the file system or device name, for example /dev/dm-0. | Use to identify the partition or logical volume. |
| 2 | Size column | Shows the total file system size, for example 20.5 GB. | Use to understand total storage capacity for a partition. |
| 3 | Used column | Shows used storage, for example 6.3 GB. | Use to identify partitions that consume significant storage. |
| 4 | Available column | Shows available storage, for example 13.1 GB. | Use to confirm remaining free space. |
| 5 | Use % column | Shows the percentage of storage used, for example 32%. | Use to find partitions approaching capacity. |
| 6 | Mounted on column | Shows the mount point, for example /. | Use to understand which path or system area uses the file system. |
Services status widget
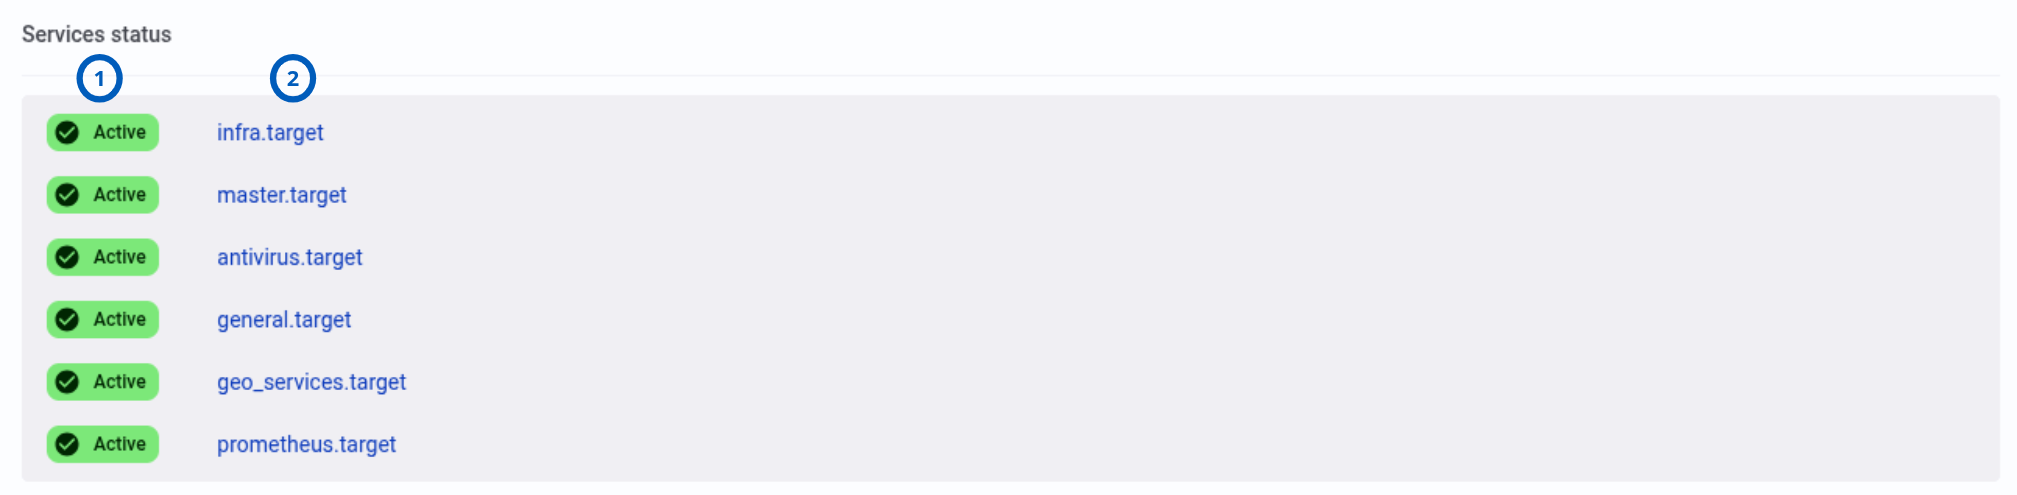
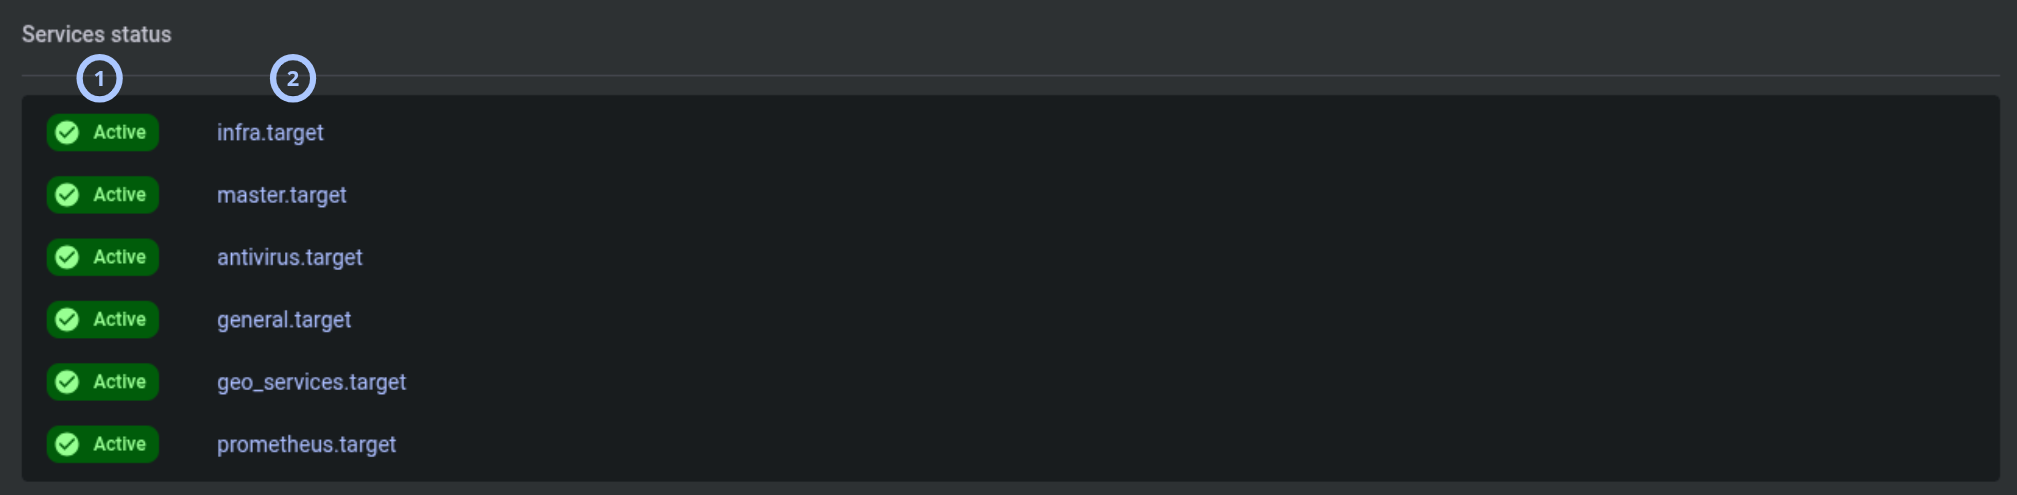
The Services status widget lists system service targets and their current status. Use it to identify services that are stopped or failed.
| Callout | UI element | Description | When to use |
|---|---|---|---|
| 1 | Service target name | Shows the service target in the format Status name.target. | Use to identify the service target being reported. |
| 2 | Status | Indicates currect service status (Active, Inactive or Failed) | Use to confirm that a required service is operational. |
The Diagnostic page reports service status. It does not provide service restart or repair actions.
Execute command widget
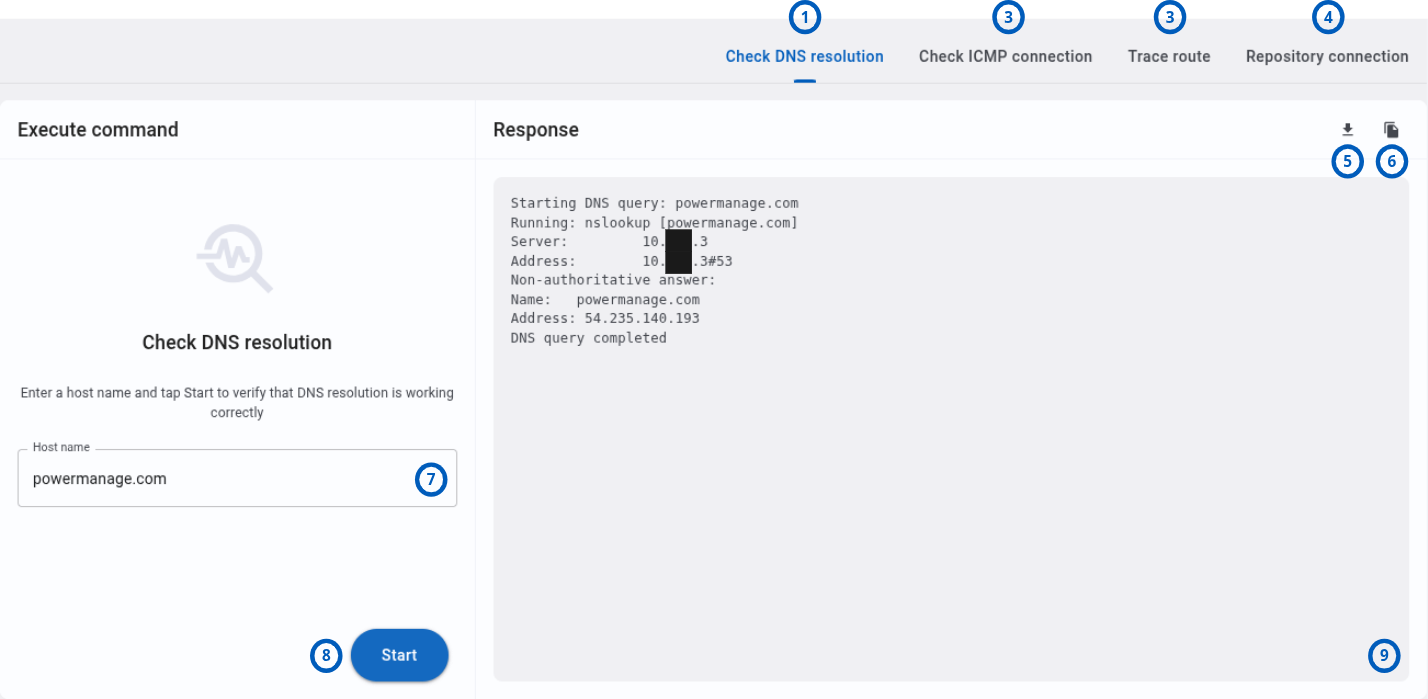
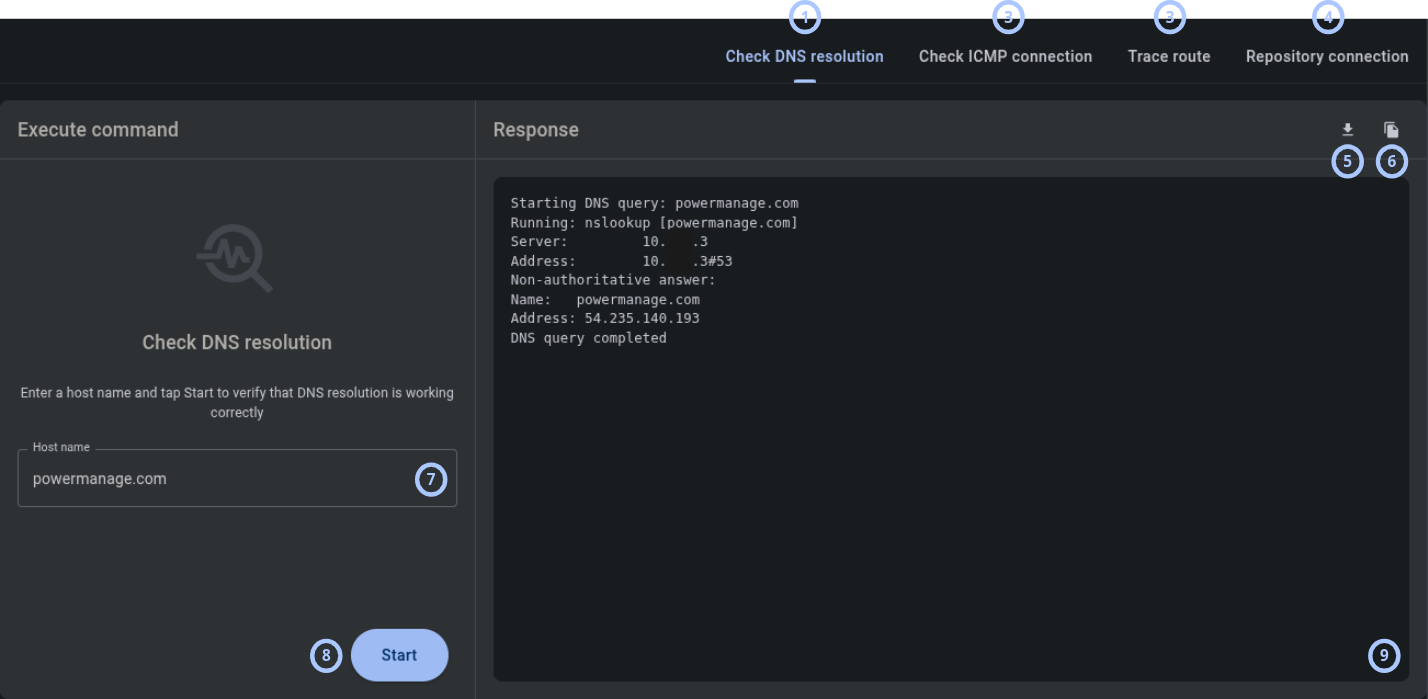
The Execute command widget provides four diagnostic tabs: Check DNS resolution, Check ICMP connection, Trace route, and Repository connection. Use this widget to test name resolution, basic reachability, routing, and repository connectivity from the PowerManage server.
The default selected tab is Check DNS resolution.
| Callout | UI element | Description | When to use |
|---|---|---|---|
| 1 | Check DNS resolution tab | Opens a DNS lookup workflow. The tab includes a Host name field, a Start button, a response window, and output actions. | Use to check whether the server can resolve a host name. |
| 2 | Check ICMP connection tab | Opens an ICMP connectivity workflow. The tab includes an IP/Host name field, a Start button, a response window, and output actions. | Use to check whether the server can reach an IP address or host by ICMP. |
| 3 | Trace route tab | Opens a route tracing workflow. The tab includes an IP/Host name field, a Start button, a response window, and output actions. | Use to inspect the network path from the server to a destination. |
| 4 | Repository connection tab | Opens an HTTPS repository connectivity workflow. The tab includes a Repository host field, a Start button, a response window, and output actions. | Use to check whether the server can reach a repository endpoint over HTTPS. |
| 5 | Save button | Saves the response window output as a .txt file. | Use when you need to attach diagnostic output to a support case or store it for records. |
| 6 | Copy button | Copies the response window output to the clipboard. | Use when you need to paste results into a support case, ticket, or message. |
| 7 | IP/Host name field | Accepts an IP address or host name for ICMP and trace route checks. | Use on the Check ICMP connection and Trace route tabs. |
| 8 | Start button | Runs the selected diagnostic check using the value entered in the field. | Use after entering a host name, IP address, or host name. |
| 9 | Response window | Shows command output or diagnostic response text. | Use to review results, errors, timeouts, and route details. |
Only enter host names and IP addresses that you are authorized to test. Network checks may be logged by destination systems.
How to use this page
Review server identity and runtime information
Goal:
- Confirm which server you are viewing and collect basic server details.
Steps:
- Open the Diagnostic page.
- In the System info widget, review the Server hostname.
- Check Uptime to identify whether the server restarted recently.
- Check Current time to confirm the server time and time zone.
- Review Public server IP, Platform, CPU model, and Serial number if you need details for a support case.
Expected result:
- You can identify the server and document its current runtime, time, platform, CPU, IP address, and serial number.
Check CPU usage
Goal:
- Determine whether CPU usage is high at the time of review.
Steps:
- Open the Diagnostic page.
- Locate the CPU usage widget.
- Review the total Cores count.
- Review the Usage bar and the current percentage.
- If usage is high, compare the value with the Load average in the System info widget.
Expected result:
- You can see current CPU usage and the number of available cores.
- You can decide whether CPU pressure may require further investigation.
Check RAM usage
Goal:
- Determine whether the server has enough available memory.
Steps:
- Open the Diagnostic page.
- Locate the RAM usage widget.
- Review the RAM usage percentage.
- Compare used RAM with total RAM in the usage bar.
Expected result:
- You can see current memory usage in percent and GB.
- You can identify whether memory usage is elevated.
Review disk read and write activity
Goal:
- Check whether disk activity is high.
Steps:
- Open the Diagnostic page.
- Locate the Disk utilization widget.
- Review Total disk read per second.
- Review Total disk write per second.
- If values are higher than expected, compare them with current application activity or maintenance tasks.
Expected result:
- You can see current aggregate disk read and write throughput.
- You can decide whether disk activity requires further investigation.
Review disk health
Goal:
- Identify disks with a failed health status.
Steps:
- Open the Diagnostic page.
- Locate the Disk health status widget.
- Review each installed disk.
- Check the status icon beside each disk.
- If a disk shows Fail, record the disk name and details.
- Follow your organization’s storage support process.
Expected result:
- Each disk shows a Good or Fail status.
- Failed disks are identified for support review.
Do not ignore a disk with a Fail status. Confirm that current backups are available and contact the responsible administrator or support team.
Review file system usage
Goal:
- Find partitions that are low on free space.
Steps:
- Open the Diagnostic page.
- Locate the Disk file system widget.
- Review the Use % column.
- For partitions with high usage, review Available and Mounted on.
- Record the file system name and mount point if you need support assistance.
Expected result:
- You can identify file systems with high usage.
- You can see the mount point affected by low free space.
Review service status
Goal:
- Identify services that are inactive or failed.
Steps:
- Open the Diagnostic page.
- Locate the Services status widget.
- Review each service target.
- Check whether the status is Active, Inactive, or Failed.
- If a required service is Inactive or Failed, record the service target name and status.
- Contact an administrator or support engineer to investigate.
Expected result:
- You can see the current status of each listed service target.
- Services that are stopped or failed are identified.
Check DNS resolution
Goal:
- Confirm that the server can resolve a host name.
Steps:
- Open the Diagnostic page.
- In the Execute command widget, select Check DNS resolution.
- In the Host name field, enter the host name to check.
- Select Start.
- Review the response window.
- Optional: Select Copy to copy the output.
- Optional: Select Save to save the output as a
.txtfile.
Expected result:
- The response window shows DNS resolution output or an error.
- You can copy or save the output for troubleshooting.
A DNS resolution failure can indicate an invalid host name, a DNS server issue, or network restrictions between the server and DNS service.
Check ICMP connectivity
Goal:
- Confirm that the server can reach an IP address or host name by ICMP.
Steps:
- Open the Diagnostic page.
- In the Execute command widget, select Check ICMP connection.
- In the IP/Host name field, enter an IP address or host name.
- Select Start.
- Review the response window.
- Optional: Select Copy to copy the output.
- Optional: Select Save to save the output as a
.txtfile.
Expected result:
- The response window shows ICMP output or an error.
- You can determine whether the destination responds to ICMP from the server.
Some networks block ICMP. A failed ICMP check does not always mean the destination application is unavailable.
Trace a route to a destination
Goal:
- Review the route path from the server to an IP address or host name.
Steps:
- Open the Diagnostic page.
- In the Execute command widget, select Trace route.
- In the IP/Host name field, enter an IP address or host name.
- Select Start.
- Review the response window.
- Optional: Select Copy to copy the output.
- Optional: Select Save to save the output as a
.txtfile.
Expected result:
- The response window shows trace route output or an error.
- You can review route hops and identify where routing may stop or time out.
Check repository connectivity
Goal:
- Confirm that the server can connect to the repository endpoint over HTTPS.
Steps:
- Open the Diagnostic page.
- In the Execute command widget, select Repository connection.
- In the Repository host field, enter the repository host name.
- Select Start.
- Review the response window.
- Optional: Select Copy to copy the output.
- Optional: Select Save to save the output as a
.txtfile.
Expected result:
- The response window shows repository connectivity output or an error.
- You can confirm the repository host response code and save the output for troubleshooting.
Example output:
Starting Repository HTTPS connectivity check:
Repository host: repo.powermanage.com
HTTP status: 200 OK
Success!
Repository HTTPS connectivity check completed
Save diagnostic output
Goal:
- Store network diagnostic output as a text file.
Steps:
- Run a DNS, ICMP, trace route, or repository connectivity check.
- Review the response window.
- Select the Save icon button.
- If your browser prompts you, choose a download location.
Expected result:
- The response output is saved as a
.txtfile. - You can attach the file to a support case or maintenance record.
Copy diagnostic output
Goal:
- Copy network diagnostic output to the clipboard.
Steps:
- Run a DNS, ICMP, trace route, or repository connectivity check.
- Review the response window.
- Select the Copy icon button.
- Paste the output into the target location, such as a support ticket.
Expected result:
- The response output is copied to the clipboard.
If the browser blocks clipboard access, select the output text manually and copy it using your browser or operating system shortcuts.
Field and option reference
System information fields
| Name | Description | Accepted values | Behavior | Restrictions | Default value |
|---|---|---|---|---|---|
| Server hostname | Server host name. | Text. | Displays the hostname reported by the server. | Read-only. | Not specified. |
| Uptime | Time since the server started. | Duration format, for example 1 day, 00:07:14. | Updates based on server runtime. | Read-only. | Not specified. |
| Load average | Server load average. | Three numeric values, for example 0.32 / 0.3 / 0.33. | Displays recent load averages reported by the server. | Read-only. | Not specified. |
| Current time | Current server date, time, and time zone. | Date and time string, for example June 3rd, 2026 - 1:59 PM GMT+3. | Displays the server time. | Read-only. | Not specified. |
| Public server IP | Public IP address detected for the server. | IPv4 or IPv6 address, depending on environment. | Displays detected public address. | Read-only. May be unavailable if detection fails or external access is restricted. | Not specified. |
| Platform | Server hardware or virtualization platform. | Text, for example innotek GmbH VirtualBox. | Displays platform data reported by the server. | Read-only. | Not specified. |
| CPU model | CPU model and core count. | Text, for example Intel(R) Xeon(R) CPU E5-2620 v3 @ 2.40GHz, 3 cores. | Displays CPU information reported by the server. | Read-only. | Not specified. |
| Serial number | Server serial number. | Text. | Displays the serial number when available. | Read-only. May be unavailable on some virtual or hardware platforms. | Not specified. |
Resource usage fields
| Name | Description | Accepted values | Behavior | Restrictions | Default value |
|---|---|---|---|---|---|
| CPU cores count | Total CPU cores available to the server. | Number. | Displayed in the CPU usage widget. | Read-only. | Not specified. |
| CPU usage | Current CPU usage. | 0–100%. | Displayed as a usage bar. | Read-only. | Not specified. |
| RAM usage percentage | Current RAM usage. | 0–100%. | Displayed as a percentage and usage bar. | Read-only. | Not specified. |
| RAM used | Amount of RAM currently used. | GB. | Displayed on the left side of the RAM usage bar. | Read-only. | Not specified. |
| Total RAM | Total RAM available to the server. | GB. | Displayed on the right side of the RAM usage bar. | Read-only. | Not specified. |
| Total disk read | Aggregate disk read throughput. | Per second. | Displays current read rate. | Read-only. | Not specified. |
| Total disk write | Aggregate disk write throughput. | Per second. | Displays current write rate. | Read-only. | Not specified. |
Disk health fields
| Name | Description | Accepted values | Behavior | Restrictions | Default value |
|---|---|---|---|---|---|
| Disk name | Disk device name. | Text, for example /dev/sda. | Identifies the disk. | Read-only. | Not specified. |
| Disk details | Disk size, bus type, model/type, and identifier. | Text, for example 48.83 GB | scsi | SCSI | VBfe2e5a71-963e0cf5. | Shows disk metadata. | Read-only. | Not specified. |
| Status icon | Disk health state. | Good or Fail. | Good appears with a green icon. Fail appears with a red icon. | Read-only. | Not specified. |
Disk file system columns
| Name | Description | Accepted values | Behavior | Restrictions | Default value |
|---|---|---|---|---|---|
| File system | File system or device name. | Text, for example /dev/dm-0. | Identifies the file system row. | Read-only. | Not specified. |
| Size | Total file system size. | Storage size, for example 20.5 GB. | Shows capacity. | Read-only. | Not specified. |
| Used | Used storage. | Storage size, for example 6.3 GB. | Shows consumed space. | Read-only. | Not specified. |
| Available | Available storage. | Storage size, for example 13.1 GB. | Shows remaining space. | Read-only. | Not specified. |
| Use % | Percentage of file system used. | Percentage, for example 32%. | Helps identify high disk usage. | Read-only. | Not specified. |
| Mounted on | Mount point path. | Path, for example /. | Shows where the file system is mounted. | Read-only. | Not specified. |
Service status values
| Name | Description | Accepted values | Behavior | Restrictions | Default value |
|---|---|---|---|---|---|
| Service target | System service target name. | Text in name.target format. | Shows the target being monitored. | Read-only. | Not specified. |
| Active | The service is currently running. | Status value. | Indicates an operational service. | Read-only. | Not specified. |
| Inactive | The service is stopped or not running. | Status value. | Indicates a service that may need review. | Read-only. | Not specified. |
| Failed | The service encountered an error and is not operational. | Status value. | Indicates a service that requires investigation. | Read-only. | Not specified. |
Execute command options
| Name | Description | Accepted values | Behavior | Restrictions | Default value |
|---|---|---|---|---|---|
| Check DNS resolution | Checks whether the server can resolve a host name. | Host name. | Runs the DNS resolution check and displays output in the response window. | Requires a valid host name and server access to DNS services. | Selected by default. |
| Check ICMP connection | Checks whether the server can reach a destination by ICMP. | IP address or host name. | Runs the ICMP check and displays output in the response window. | ICMP may be blocked by firewall or destination policy. | Not selected. |
| Trace route | Checks the route path from the server to a destination. | IP address or host name. | Runs a route trace and displays output in the response window. | Some hops may not respond. Firewalls may block route tracing. | Not selected. |
| Repository connection | Checks whether the server can connect to a repository endpoint over HTTPS. | Repository host name. | Runs an HTTPS connectivity check and displays output in the response window. | Requires DNS resolution, TCP/443 access, and a valid TLS chain to the repository endpoint. | Not selected. |
| Host name | Input field for DNS checks. | Host name. | Used by the DNS resolution workflow. | Required before selecting Start. | Blank. |
| IP/Host name | Input field for ICMP and trace route checks. | IP address or host name. | Used by ICMP and trace route workflows. | Required before selecting Start. | Blank. |
| Start | Runs the selected network check. | Button. | Displays command output in the response window. | Requires a value in the relevant input field. | N/A. |
| Response window | Displays network check output. | Text output. | Shows results, errors, or timeout information. | Read-only. | Blank until a check runs. |
| Copy | Copies output to the clipboard. | Icon button. | Copies response window text. | Requires browser clipboard permission. | N/A. |
| Save | Saves output as a text file. | Icon button. | Downloads response output as a .txt file. | Depends on browser download settings. | N/A. |
Tips
- Start with the System info widget to confirm that you are reviewing the correct server.
- Compare Uptime with incident times. A recent uptime can indicate that the server restarted.
- Review CPU usage, RAM usage, and Disk utilization together. High values in more than one widget may indicate resource pressure.
- Check Disk file system before planned maintenance to confirm that enough free space is available.
- Save network check output when you create a support case. Text output helps support engineers compare DNS, ICMP, and routing behavior.
- Use Trace route after DNS and ICMP checks when you need more detail about where network communication stops.
Troubleshooting
The Diagnostic page is not visible
Possible causes
- Your role does not include access to the Diagnostic page.
What to do
- Open Dashboard and check whether Diagnostic appears at the top of the page.
- If the link is missing, ask an administrator to confirm your role permissions.
- If you recently received access, sign out and sign in again.
Widgets show empty or unavailable values
Possible causes
- Diagnostic data collection is unavailable.
- The server cannot report the requested value.
- The value is not available on the current hardware or virtual platform.
- The page has not refreshed after a temporary server issue.
What to do
- Refresh the Diagnostic page.
- Check whether other widgets show data.
- Record which fields are empty or unavailable.
- Contact support or an administrator if values remain unavailable.
CPU usage or RAM usage is high
Possible causes
- A scheduled task or maintenance process is running.
- User activity or event processing increased server load.
- A service or process is consuming more resources than expected.
What to do
- Review CPU usage, RAM usage, and Load average.
- Check whether high usage continues after several minutes.
- Review related operational activity, such as maintenance windows or high event volume.
- Contact an administrator or support engineer if usage stays high or affects service.
Disk health shows Fail
Possible causes
- A disk reported a hardware or health error.
- The server received a failed status from the storage layer.
- Disk health information is incomplete or unreliable in the current virtual environment.
What to do
- Record the disk name and disk details.
- Confirm that backups are available and current.
- Do not make storage changes without following your maintenance procedure.
- Contact the responsible administrator or support team.
File system usage is high
Possible causes
- Logs, backups, temporary files, or application data are consuming storage.
- A partition is smaller than required for current usage.
- A cleanup or rotation process is not running as expected.
What to do
- Identify the file system with high Use %.
- Record the Mounted on value.
- Check whether the usage is expected for the mount point.
- Contact an administrator to review cleanup, rotation, or storage expansion options.
A service is Inactive or Failed
Possible causes
- The service is intentionally stopped.
- The service failed during startup or runtime.
- A dependency required by the service is unavailable.
What to do
- Record the service target name and status.
- Check whether the service is required in your deployment.
- Contact an administrator or support engineer to review service logs and dependencies.
DNS resolution check fails
Possible causes
- The host name is incorrect.
- DNS servers are unavailable from the PowerManage server.
- Network or firewall policy blocks DNS traffic.
What to do
- Check the host name for spelling errors.
- Try a known working host name.
- Save or copy the output.
- Contact the network administrator if DNS resolution fails for multiple known host names.
ICMP check fails
Possible causes
- The destination is offline or unreachable.
- ICMP is blocked by a firewall or destination policy.
- DNS resolution failed when a host name was used.
- Routing from the server to the destination is unavailable.
What to do
- Confirm that the IP address or host name is correct.
- If you used a host name, run Check DNS resolution for the same host.
- Run Trace route to inspect the route path.
- Save or copy the output for support.
Trace route does not complete
Possible causes
- A network device blocks trace route responses.
- A firewall blocks traffic on the route.
- The destination is unreachable.
- Some intermediate hops are configured not to respond.
What to do
- Confirm that the IP address or host name is correct.
- Run Check DNS resolution if you used a host name.
- Run Check ICMP connection to test basic reachability.
- Save or copy the trace route output.
- Contact the network administrator if the route stops unexpectedly.
Repository connectivity check fails
Possible causes
- The repository host name is incorrect.
- DNS resolution fails for the repository host.
- A firewall or proxy blocks outbound HTTPS traffic.
- The repository endpoint is unavailable or returns an error status.
- TLS trust validation fails on the server.
What to do
- Confirm that the repository host name is correct.
- Run Check DNS resolution for the same host.
- Confirm that outbound HTTPS (TCP/443) is allowed from the server.
- Save or copy the output and include it in your support case.
- Contact the network administrator or repository service owner if the issue continues.
Copy output does not work
Possible causes
- Browser clipboard access is blocked.
- The browser is not allowed to use the clipboard from the current site.
- No output is available in the response window.
What to do
- Confirm that the response window contains output.
- Allow clipboard access if the browser prompts you.
- If copy still fails, select the output text manually and copy it using your browser or operating system shortcut.
Save output does not download a file
Possible causes
- Browser downloads are blocked.
- No output is available in the response window.
What to do
- Confirm that the response window contains output.
- Check your browser download prompt or downloads list.
- Allow downloads from the PowerManage UI if the browser blocks them.
- If needed, use Copy and paste the output into a text file manually.