Dashboard
Overview
The Dashboard tab in Equipment hub shows panel widgets for the selected panel.
Use this tab to:
- Review panel identity, connection status, service plan, troubles, alarms, group, type, and app access.
- Open panel information and connection details.
- Review assigned accounts, installers, devices, dealer information, remarks, reports, remote inspections, events, and processes.
- Navigate to related Equipment hub tabs and filtered pages.
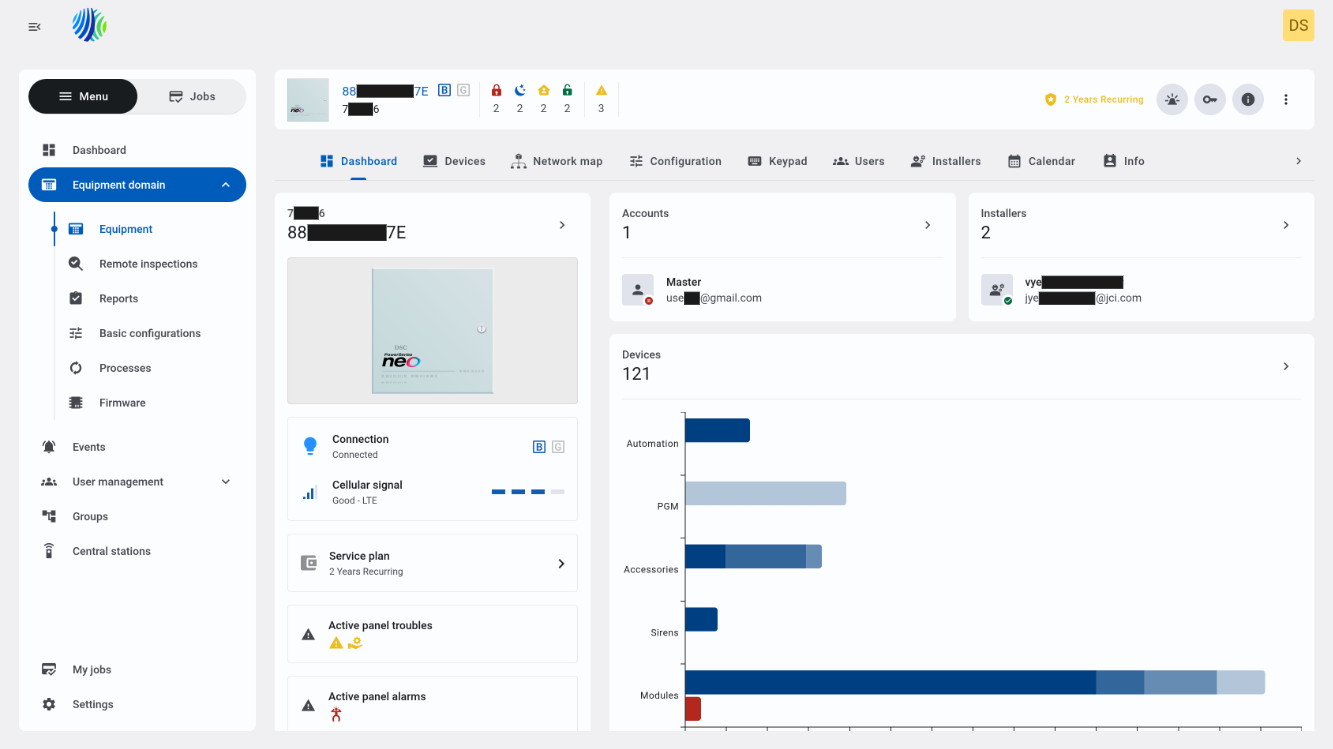
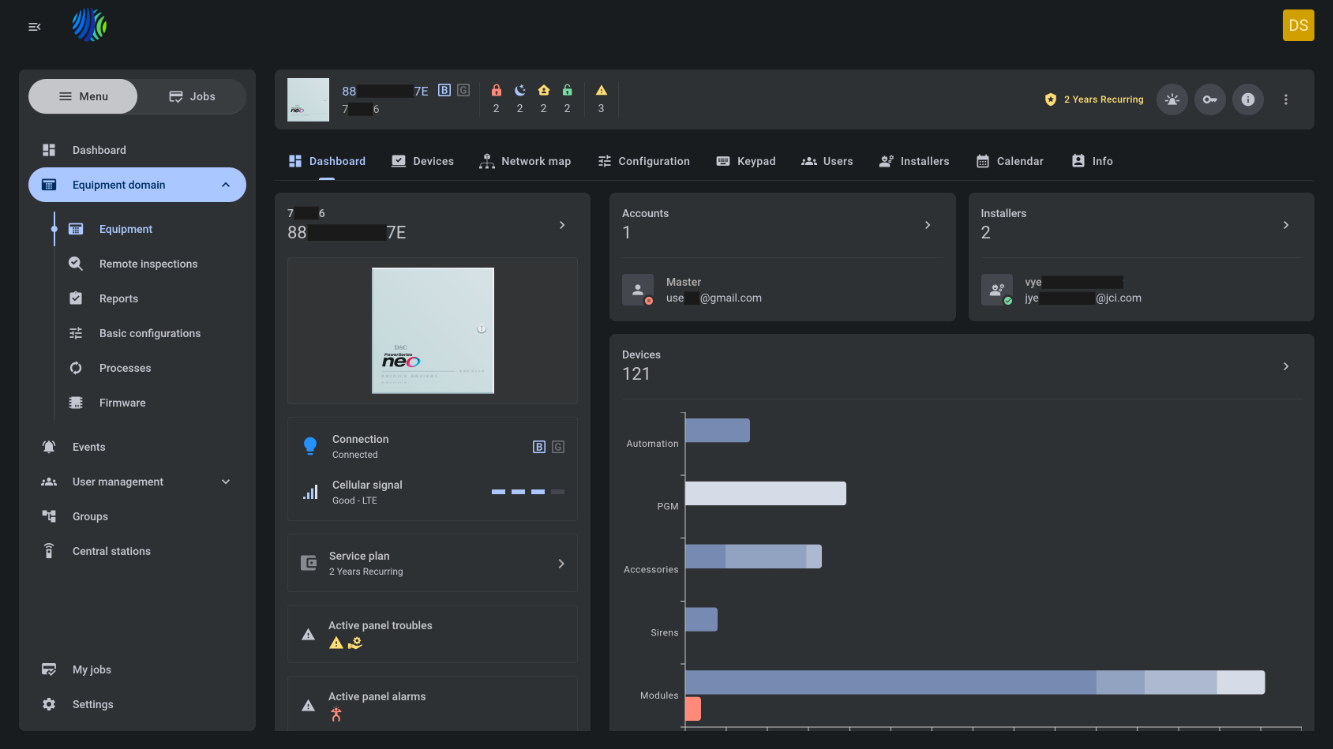
Dashboard widgets can show different data depending on panel model, panel group, billing support, discovery state, and role permissions.
Before you begin
Required permissions
Required permissions depend on the widget and action that you want to use.
- You must have permission to view the selected panel.
- You must have permission to view panel users, installers, devices, events, processes, reports, and remote inspections to use the related widgets and navigation links.
- You must have permission to manage installer or customer application access to use the related toggles.
Access to the Equipment hub page and panel management is controlled by the role permission group named Unit.
Preconditions
- Open Equipment hub by selecting a panel from the Equipment page.
- The selected panel must exist on the PowerManage server.
- Some widget data depends on panel discovery, panel communication, billing configuration, and role permissions.
- Report and remote inspection counters depend on schedules that include the selected panel.
Dependencies
- Billing data is shown only for supported panels and groups.
- Events data depends on events received for the selected panel.
- Processes data depends on processes related to panels visible to the current user's role and group permissions.
Important limitations
- Widgets can show empty states when no related accounts, installers, devices, reports, remote inspections, events, processes, or remarks exist for the selected panel.
Page layout
Main widget
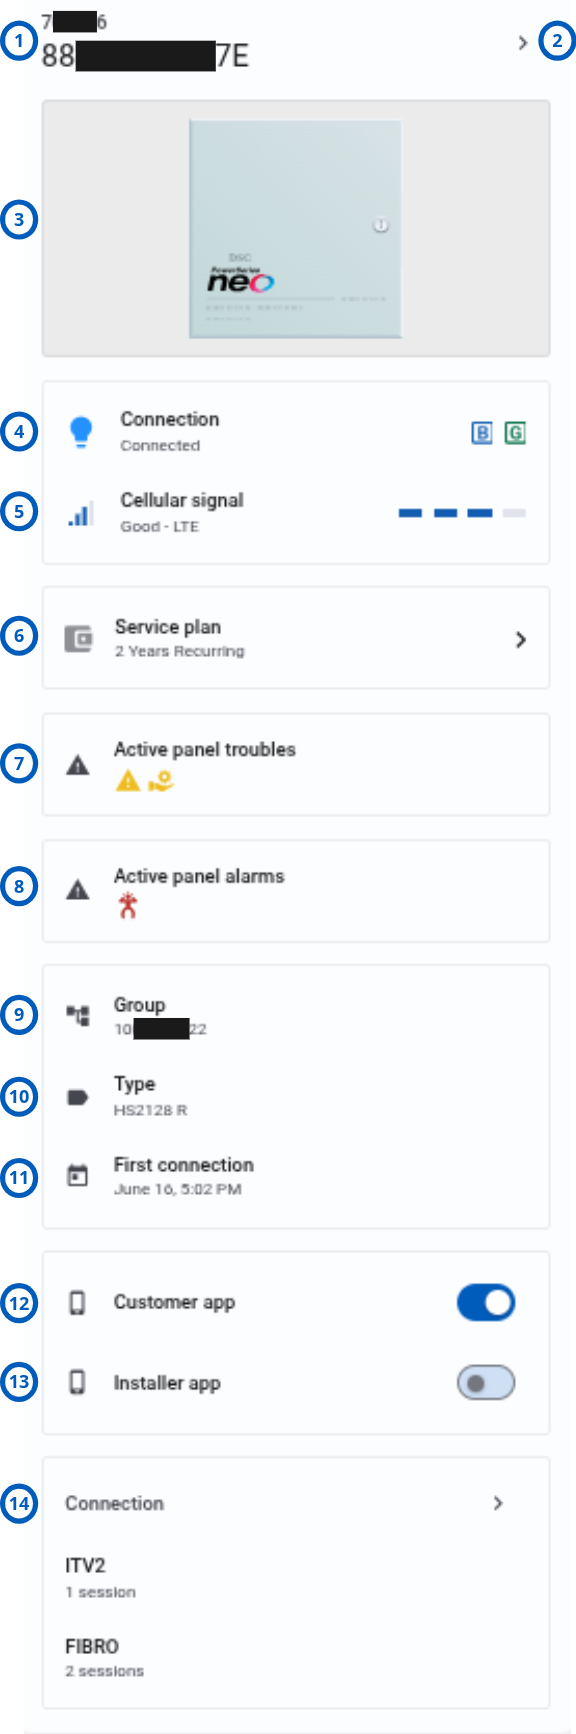
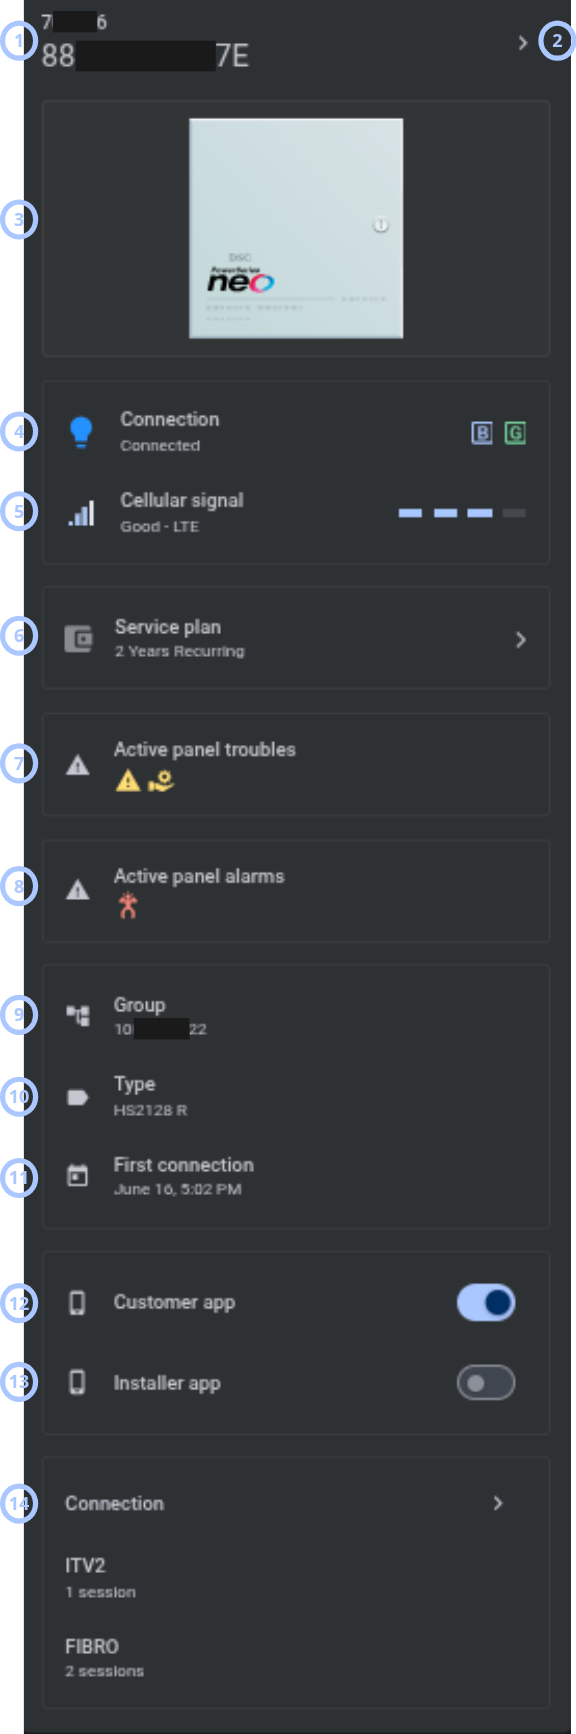
The main widget shows the primary panel summary and quick actions for the selected panel.
| Callout | UI element | Description | When to use |
|---|---|---|---|
| 1 | Panel ID and panel account code | Shows the panel ID and panel account code. | Use to confirm that you are reviewing the correct panel. |
| 2 | Navigation icon | Opens the Panel info modal window. | Use to review additional panel information. |
| 3 | Panel icon | Shows the panel icon. | Use to visually identify the panel family. |
| 4 | Panel connection status | Shows the connection bulb, status, and connection channels. | Use to review whether the panel is connected and which channels are available. |
| 5 | Cellular or Wi-Fi signal | Shows cellular signal strength and a connection strength indicator. For some panels, this can show Wi-Fi signal strength. | Use to review signal quality. |
| 6 | Service plan | Shows the current panel billing plan. The navigation icon opens the Billing plan modal window. | Use to review or manage billing information for supported panels. |
| 7 | Active panel troubles | Shows active panel trouble icons. Hover over an icon to see the trouble description. | Use to quickly identify active troubles. |
| 8 | Active panel alarms | Shows active panel alarm icons. Hover over an icon to see the alarm description. | Use to quickly identify active alarms. |
| 9 | Group | Shows the panel group. | Use to understand the panel group assignment. |
| 10 | Type | Shows the panel model. | Use to identify the panel model or family. |
| 11 | First connection | Shows the panel first connection timestamp. | Use to review when the panel first connected to the server. |
| 12 | Customer app toggle | Enables or disables customer access through the ConnectAlarm app. | Use to control customer app access for the panel. |
| 13 | Installer app toggle | Enables or disables installer access through the AlarmInstall app. | Use to control installer app access for the panel. |
| 14 | Connection | Shows panel sessions by protocol. The navigation icon opens the Panel info modal window on the Connection status tab. | Use to review panel protocol sessions and connection details. |
Accounts widget
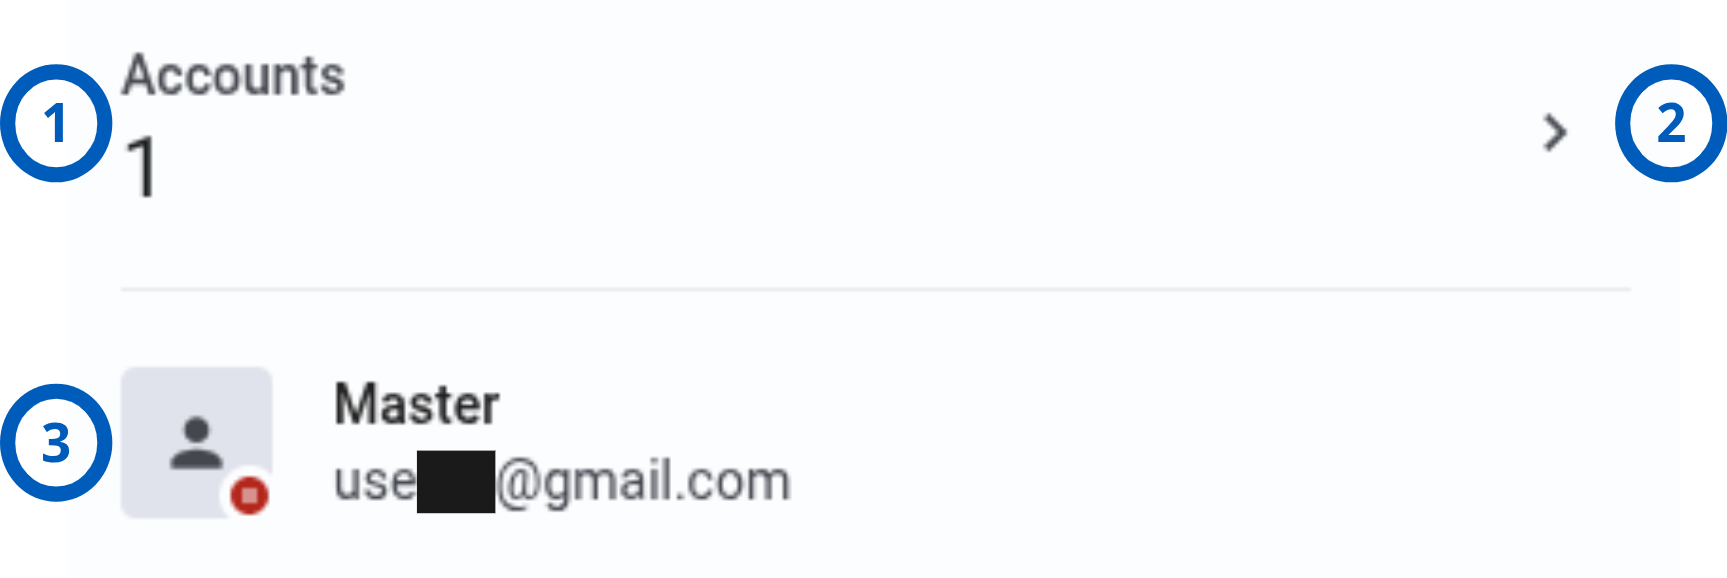
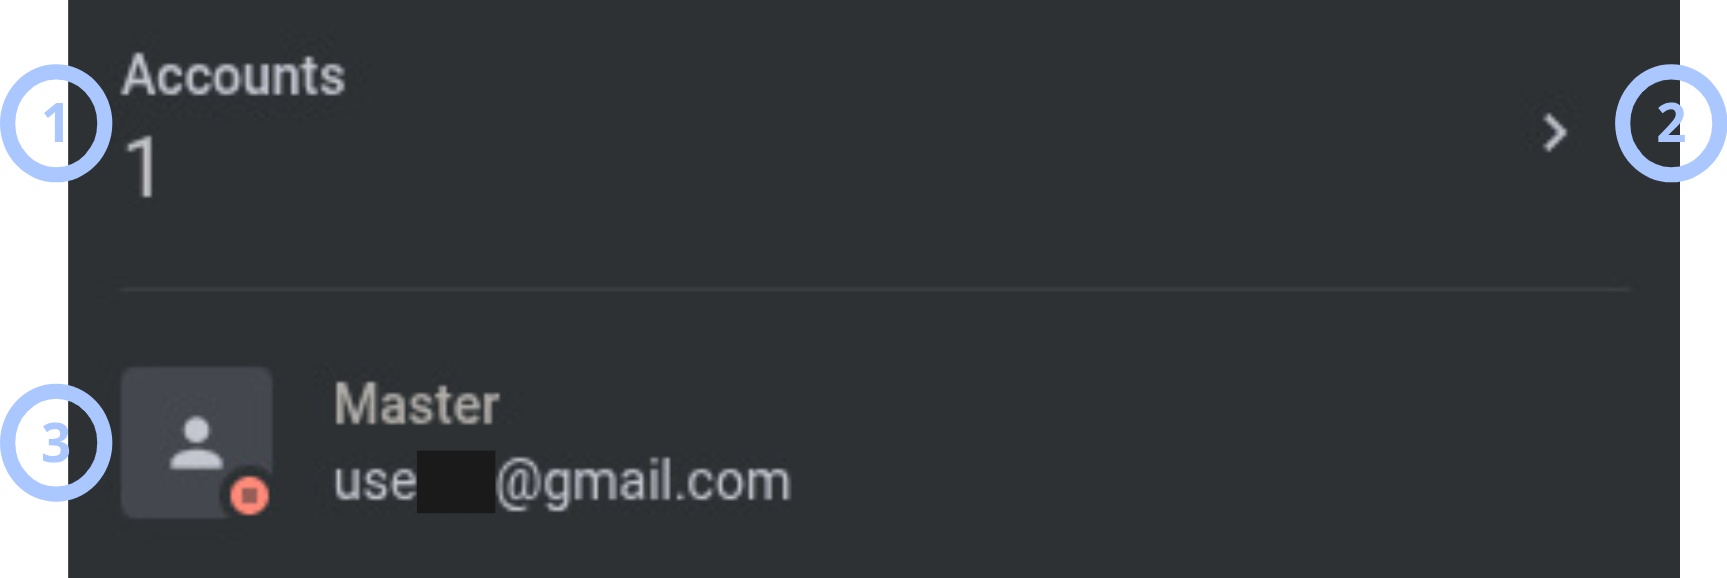
The Accounts widget shows accounts assignment information for the selected panel.
| Callout | UI element | Description | When to use |
|---|---|---|---|
| 1 | Widget name and assigned accounts count | Shows the widget name and the number of assigned accounts. | Use to understand how many accounts are assigned to the panel. |
| 2 | Navigation icon | Opens the Users tab in Equipment hub. | Use to review or manage panel users. |
| 3 | Last assigned account | Shows the account icon, account status icon, panel user name, and account email. | Use to review the most recently assigned account. |
Installers widget
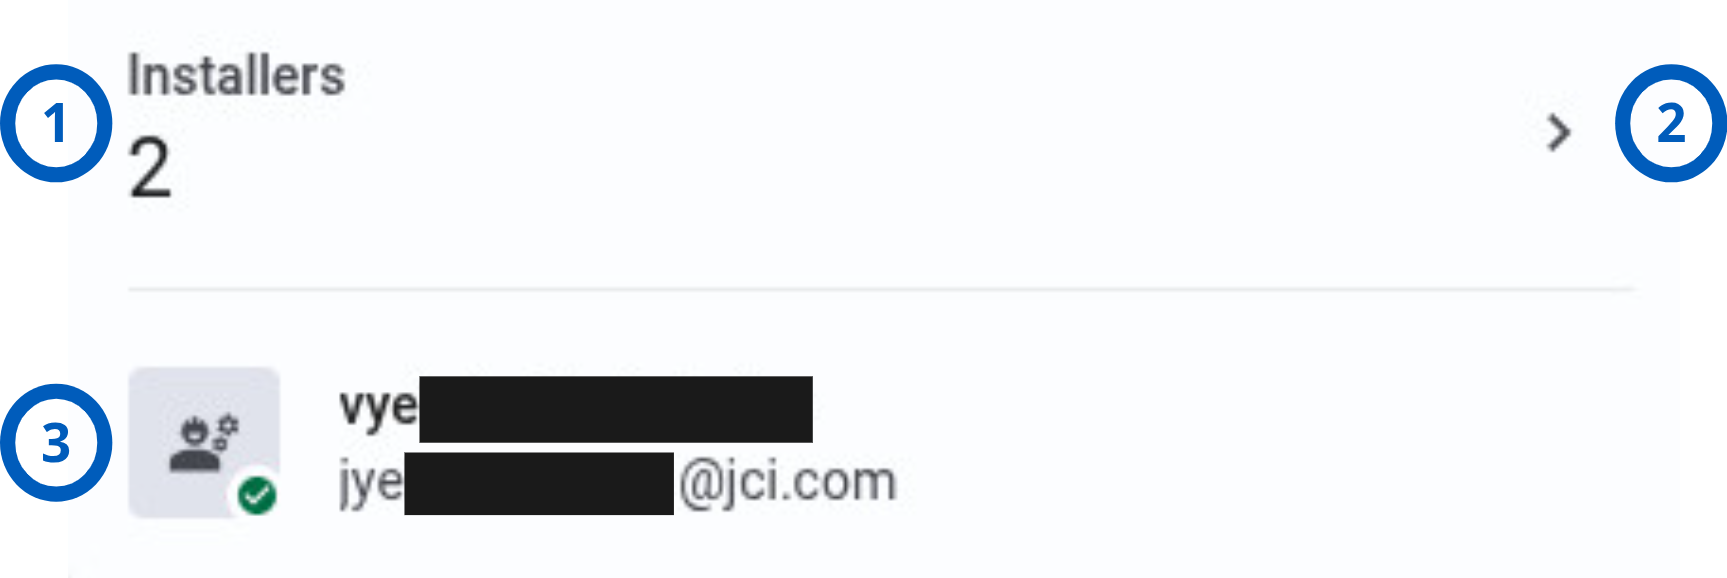
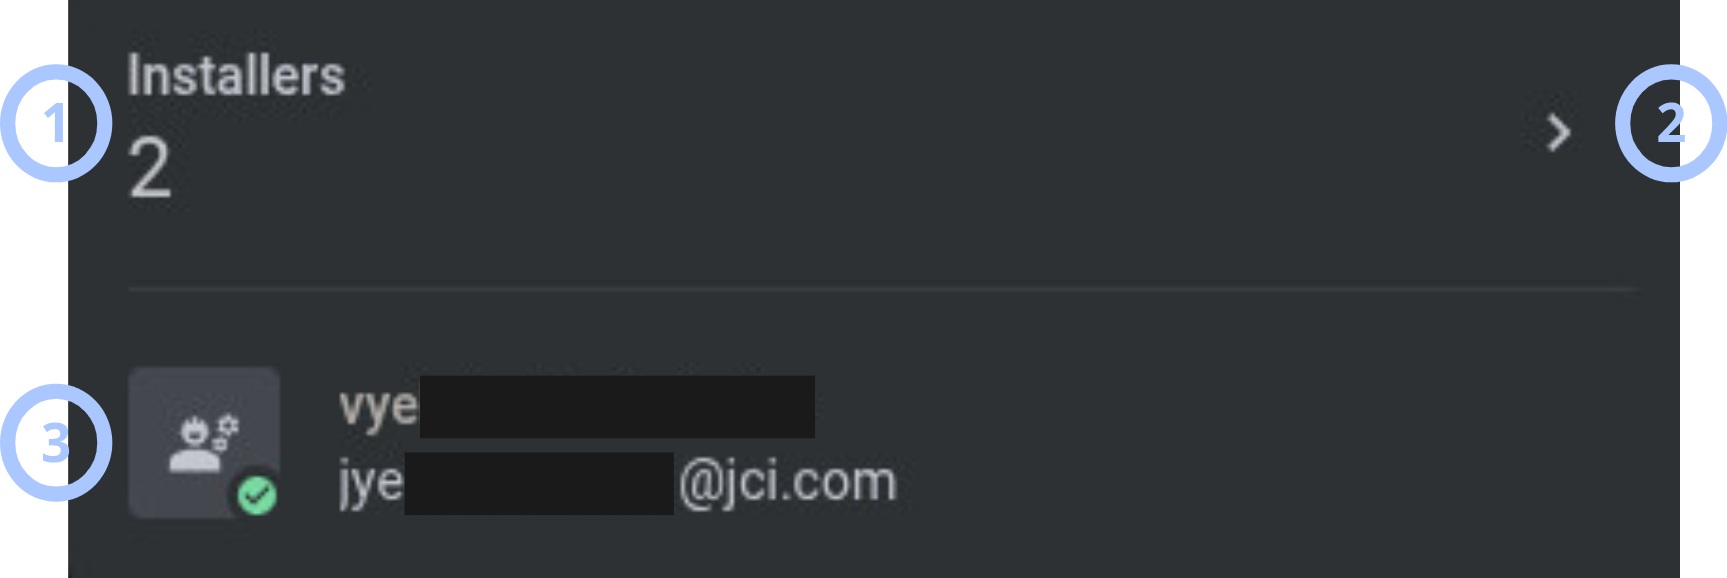
The Installers widget shows installer assignment information for the selected panel.
| Callout | UI element | Description | When to use |
|---|---|---|---|
| 1 | Widget name and assigned installers count | Shows the widget name and the number of assigned installers. | Use to understand how many installers are assigned to the panel. |
| 2 | Navigation icon | Opens the Installers tab in Equipment hub. | Use to review or manage panel installers. |
| 3 | Last assigned installer | Shows the installer icon, installer status icon, installer name, and installer email. | Use to review the most recently assigned installer. |
Devices widget
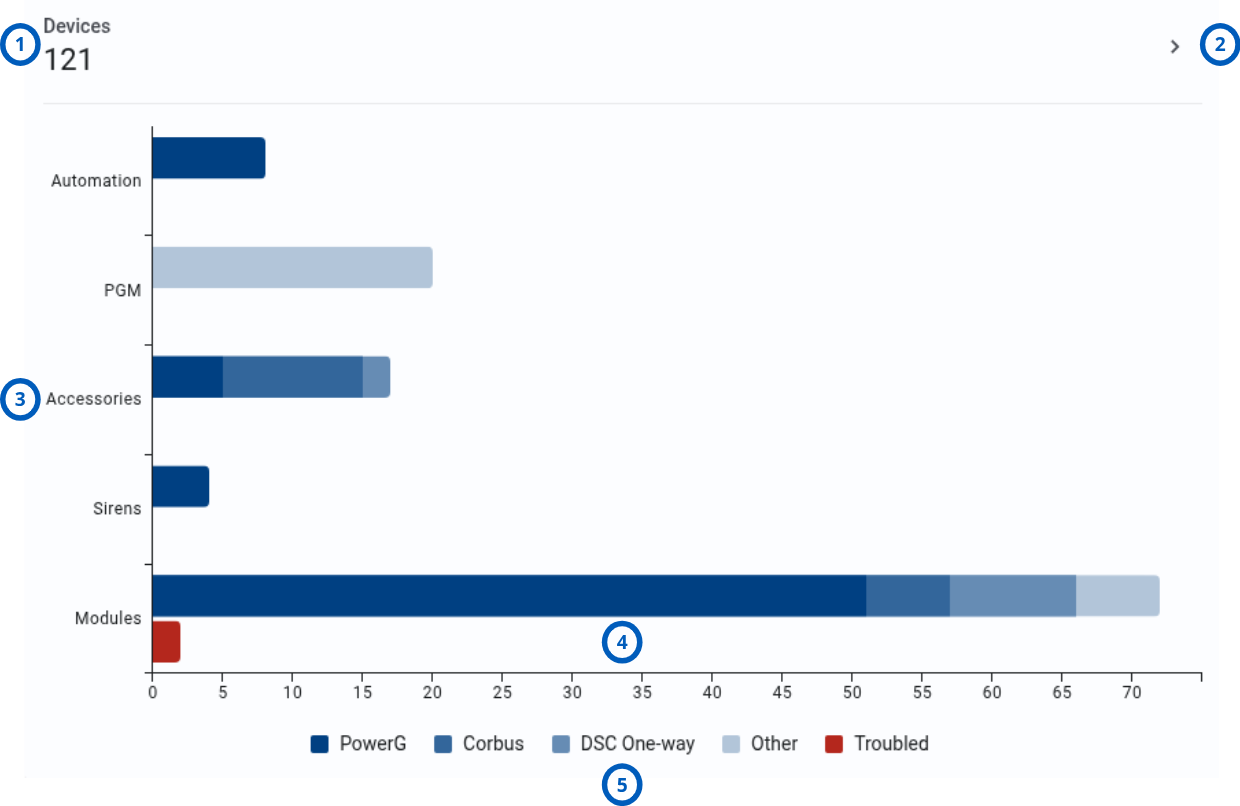
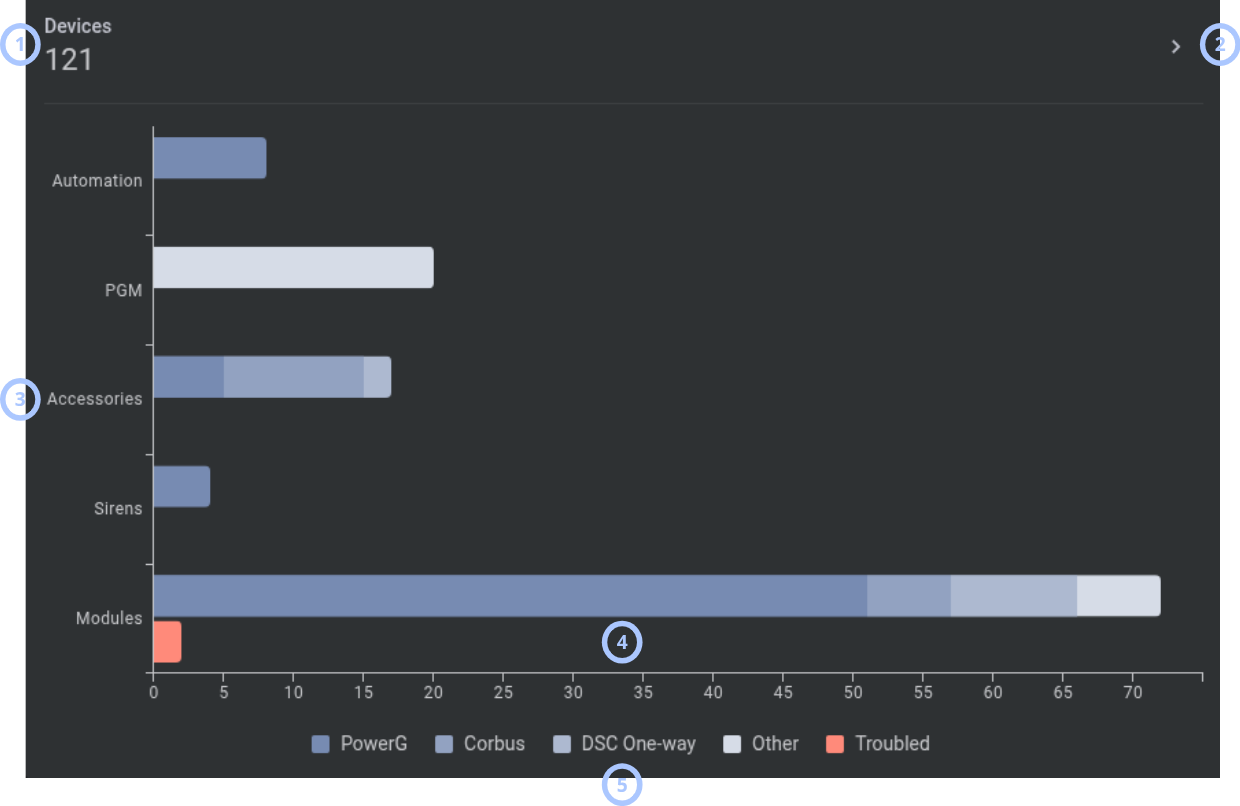
The Devices widget summarizes panel devices by type and protocol.
| Callout | UI element | Description | When to use |
|---|---|---|---|
| 1 | Widget name and panel devices count | Shows the widget name and the number of panel devices. | Use to understand how many devices are enrolled on the panel. |
| 2 | Navigation icon | Opens the Devices tab in Equipment hub. | Use to review panel devices. |
| 3 | Panel device types | Shows panel device types on a chart. | Use to review device distribution by type. |
| 4 | Panel devices count by type | Shows the device count for each type on the chart. | Use to compare device quantities by type. |
| 5 | Series chart | Shows device protocols and types. | Use to understand the device mix by protocol and type. |
Dealer info widget
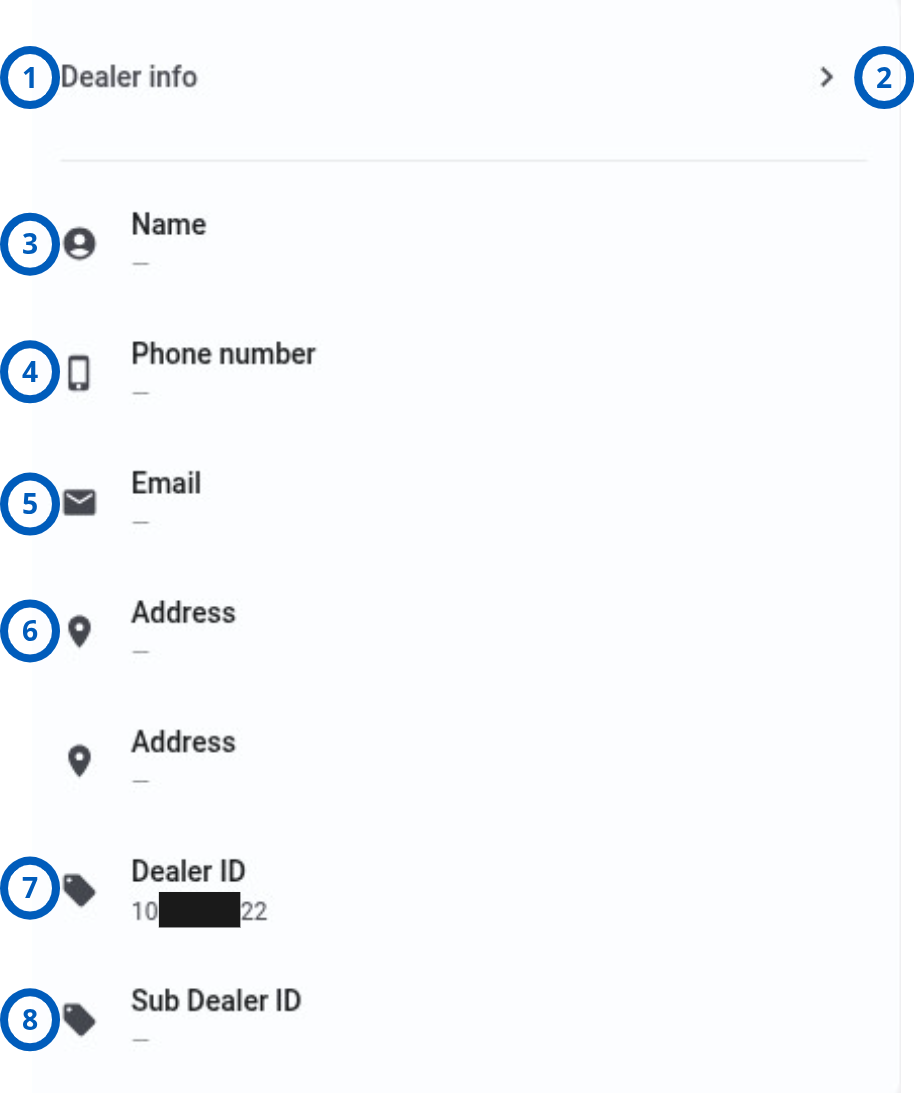
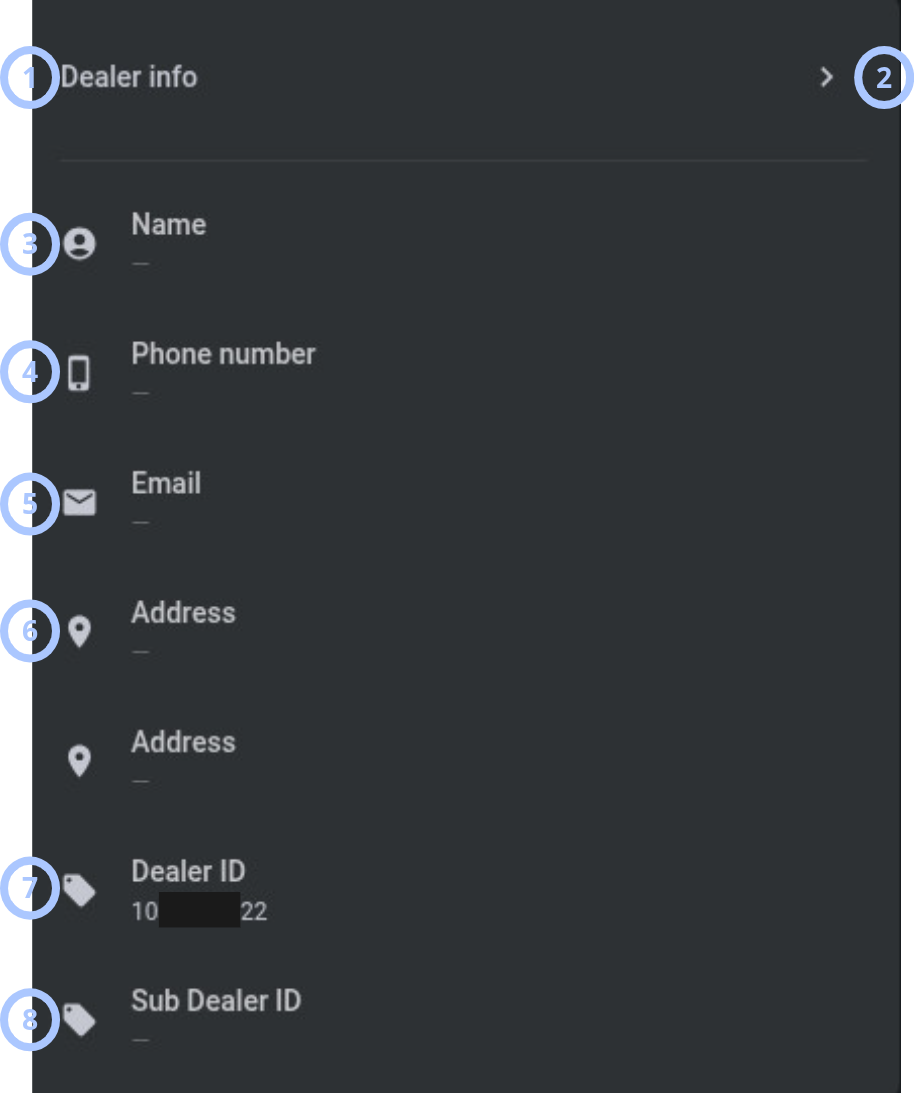
The Dealer info widget shows dealer contact and identification information for the selected panel.
| Callout | UI element | Description | When to use |
|---|---|---|---|
| 1 | Widget name | Shows the widget name. | Use to identify the dealer information area. |
| 2 | Navigation icon | Opens the Info tab in Equipment hub. | Use to review more panel and dealer information. |
| 3 | Name | Shows the dealer name. | Use to identify the dealer. |
| 4 | Phone number | Shows the dealer phone number. | Use to contact the dealer. |
| 5 | Shows the dealer email address. | Use to contact the dealer by email. | |
| 6 | Address | Shows the dealer address. | Use to review dealer location information. |
| 7 | Dealer ID | Shows the dealer ID. | Use to identify the dealer. |
| 8 | Sub Dealer ID | Shows the sub dealer ID. | Use to identify the sub dealer when available. |
Remarks widget
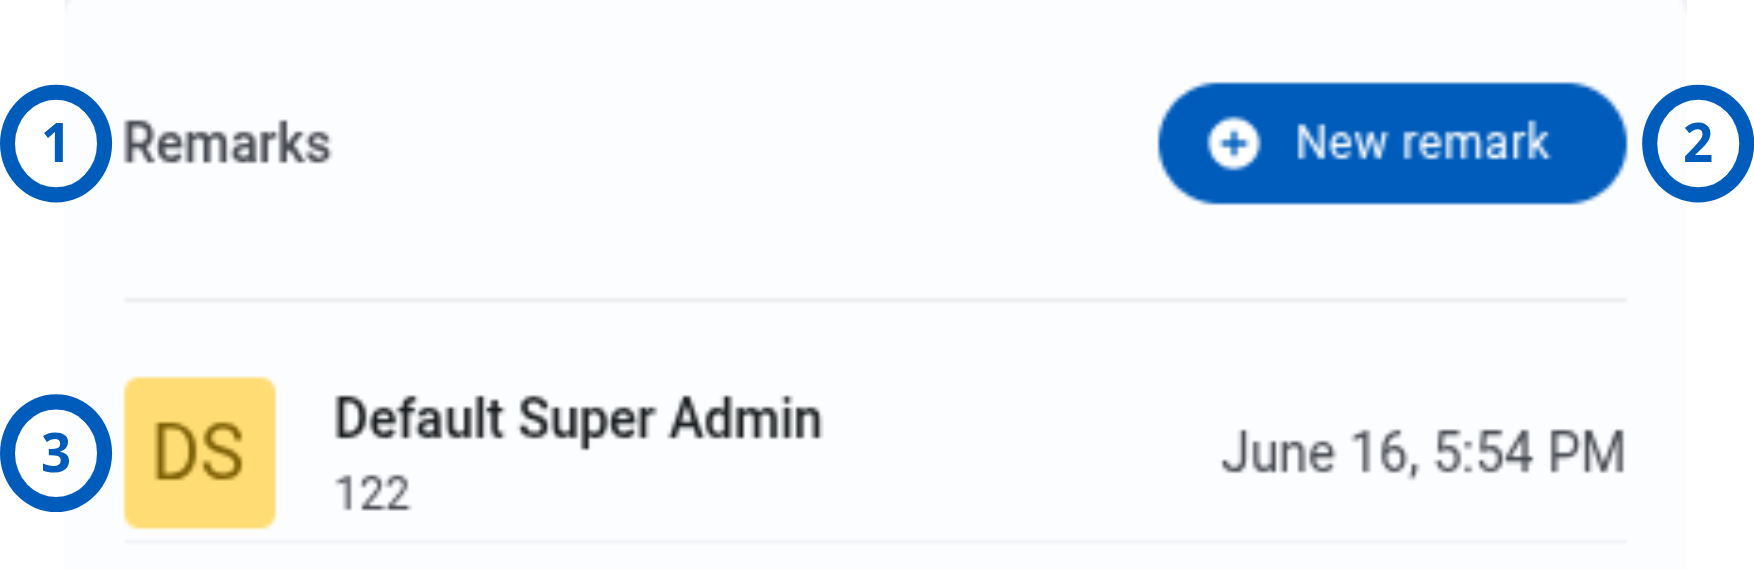
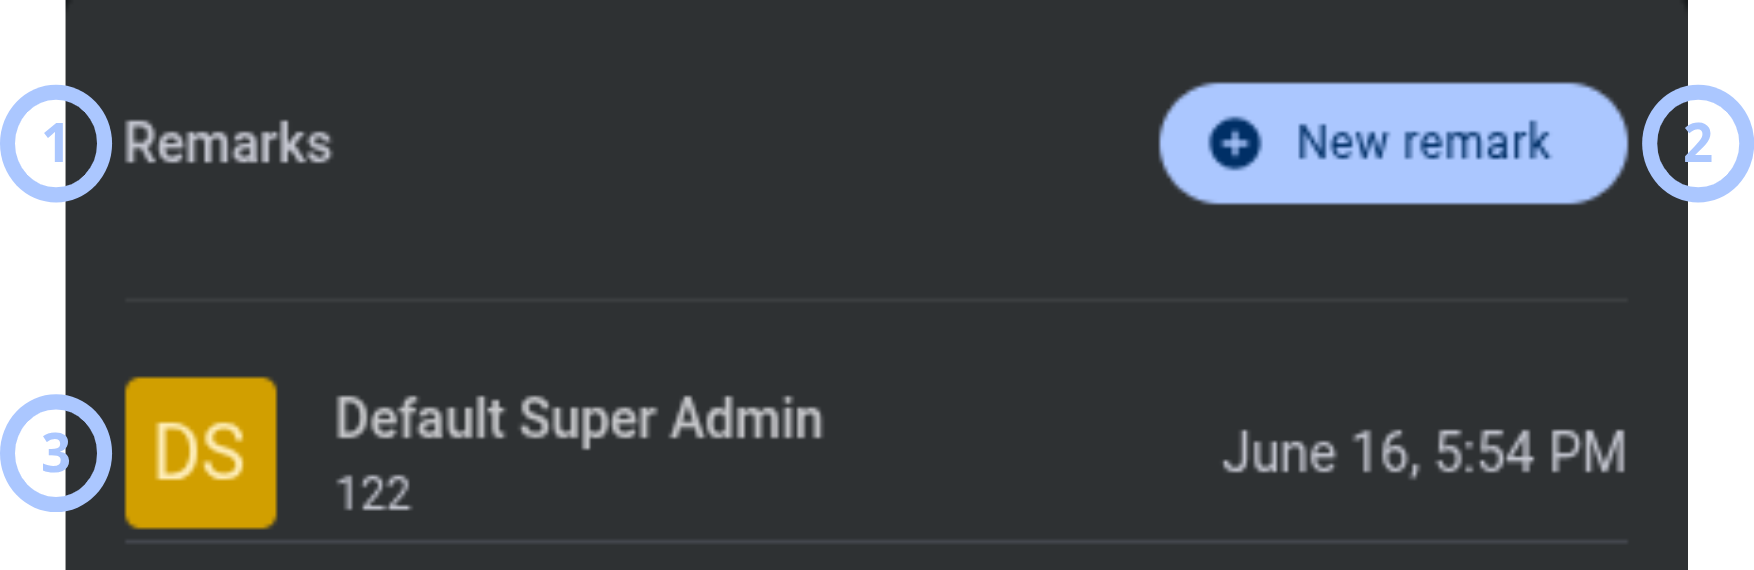
The Remarks widget shows recent remarks for the selected panel and provides a shortcut for adding a remark.
| Callout | UI element | Description | When to use |
|---|---|---|---|
| 1 | Widget name | Shows the widget name. | Use to identify the remarks area. |
| 2 | New remark button | Opens the Additional actions and info modal window on the Remarks tab. | Use to add a new panel remark. |
| 3 | Remark | Shows a remark with employee icon, employee name, remark text, and timestamp. | Use to review the latest panel note. |
Reports widget
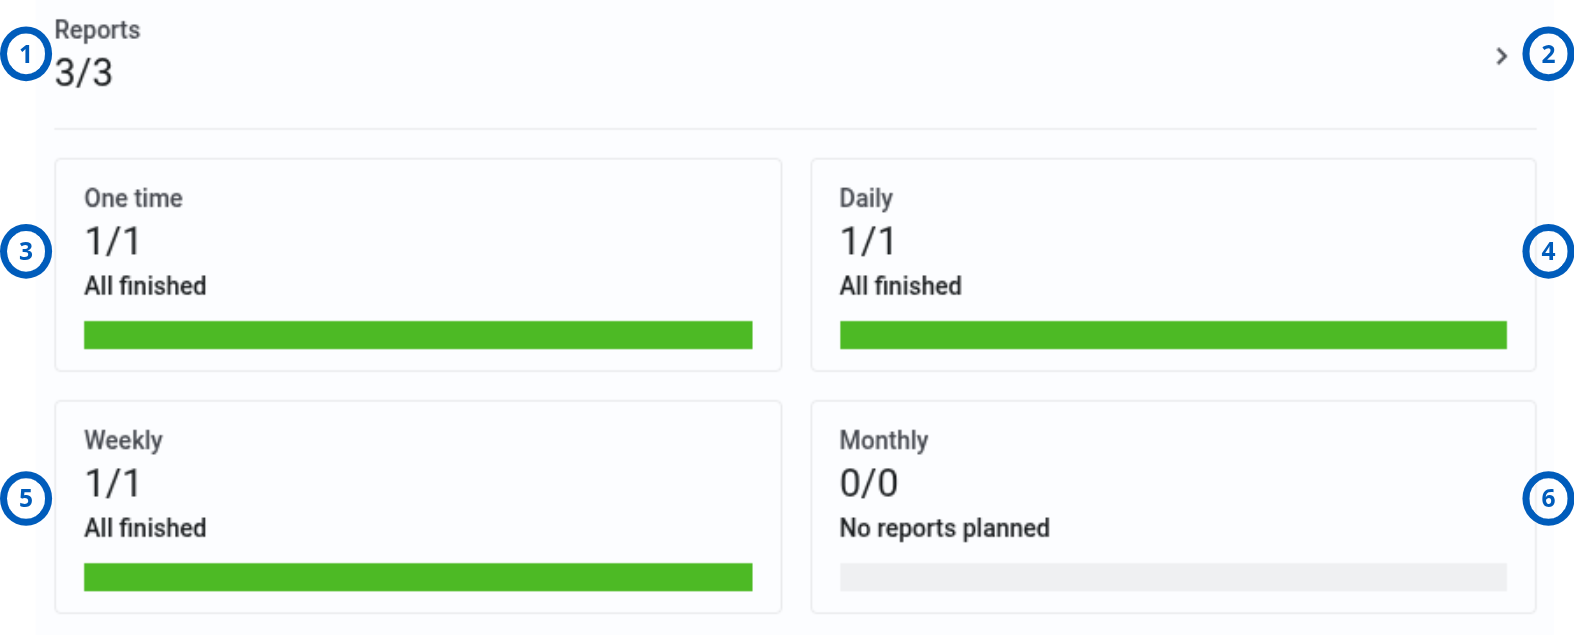
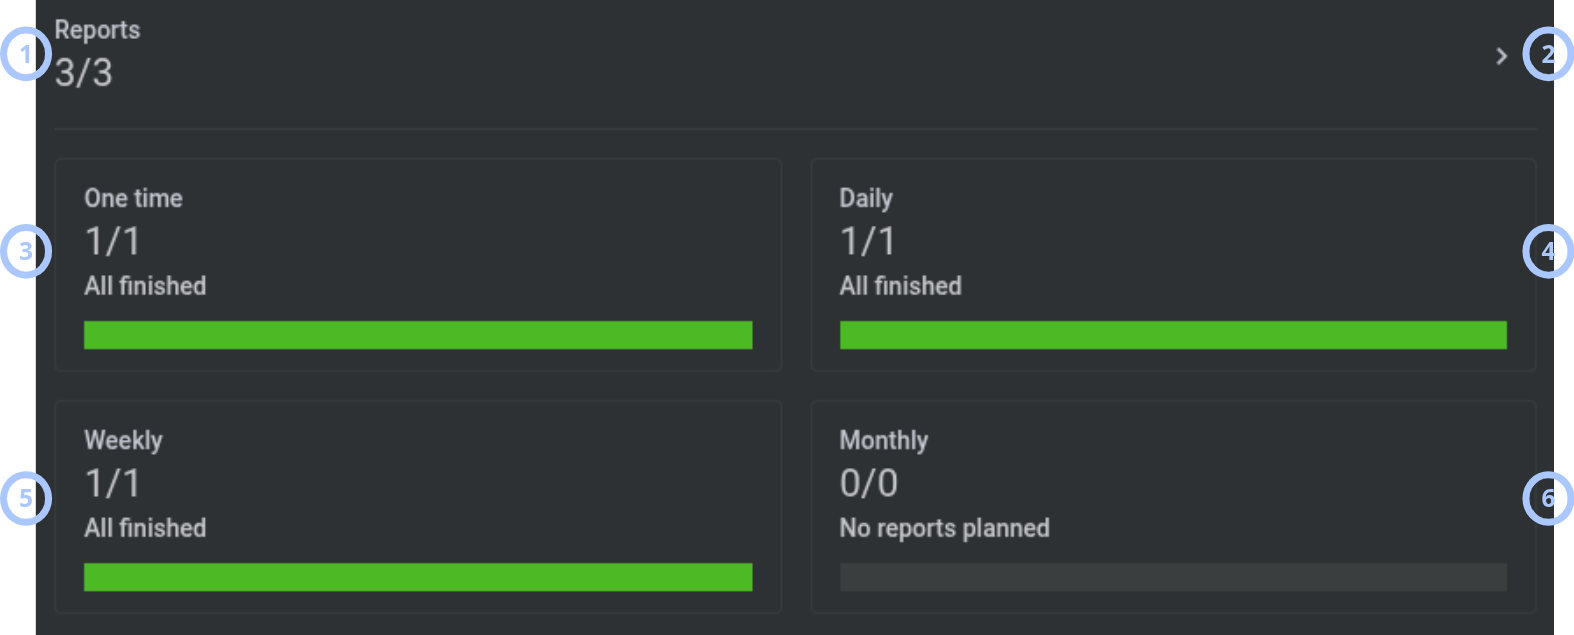
The Reports widget summarizes report schedules that include the selected panel.
| Callout | UI element | Description | When to use |
|---|---|---|---|
| 1 | Widget name and completed/total reports count | Shows the widget name and the overall report execution summary as completed/total, for example, 2/4. Completed is the sum of finished reports across all frequency types. Total is the count of all report schedules that include this panel. | Use to review overall report execution progress. |
| 2 | Navigation icon | Opens the Calendar tab in Equipment hub. | Use to review report schedules on the calendar. |
| 3 | One-time reports section | Shows completed vs. total one-time reports planned for today, nearest scheduled report time, All finished, or No reports planned. Includes a progress bar and a Stop button for incomplete one-time reports planned for today. | Use to review and stop today's one-time reports. |
| 4 | Daily reports section | Shows completed vs. total daily reports planned for today, nearest scheduled report time, All finished, or No reports planned. Includes a progress bar and a Stop button. | Use to review and stop today's daily reports. |
| 5 | Weekly reports section | Shows completed vs. total weekly reports planned for the current week, nearest scheduled report time, All finished, or No reports planned. Includes a progress bar and a Stop button. | Use to review and stop weekly reports for the current week. |
| 6 | Monthly reports section | Shows completed vs. total monthly reports planned for the current month, nearest scheduled report time, All finished, or No reports planned. Includes a progress bar and a Stop button. | Use to review and stop monthly reports for the current month. |
When you select Stop for report schedules, a confirmation dialog appears before incomplete reports are canceled.
Remote inspections widget
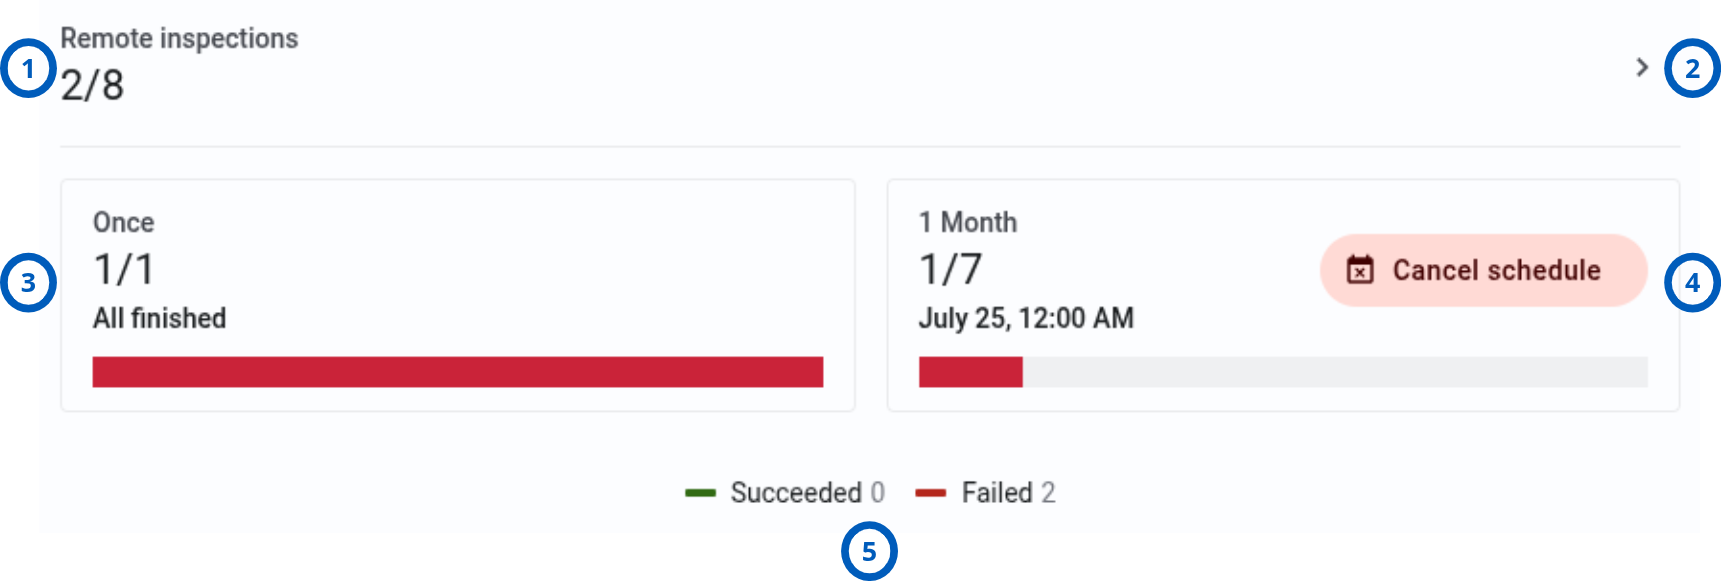
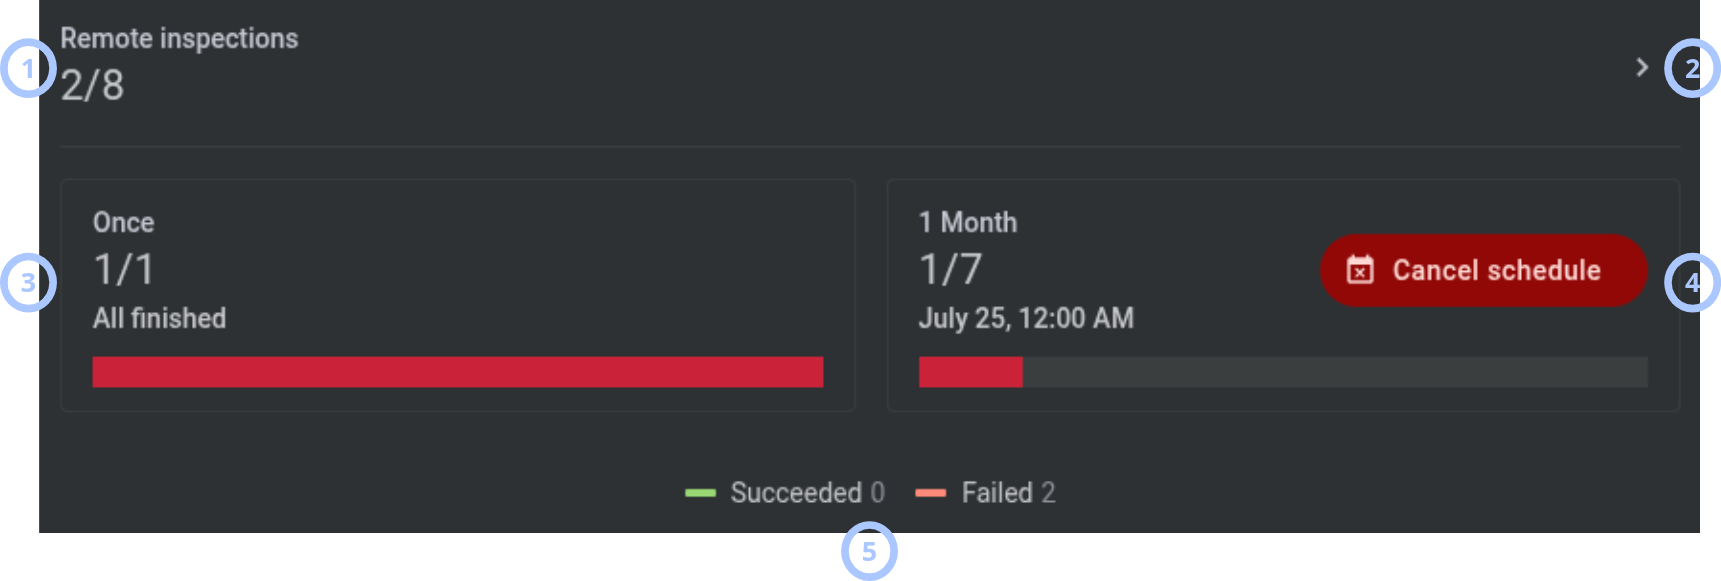
The Remote inspections widget summarizes one-time and scheduled remote inspections for the current year.
| Callout | UI element | Description | When to use |
|---|---|---|---|
| 1 | Widget name and completed/total remote inspections count | Shows Remote Inspections and the total remote inspections counter as completed/total, for example, 1/3. Completed is the sum of succeeded and failed inspections across one-time and scheduled types for the current year. Total is the count of all planned inspections for the current year. | Use to review overall remote inspection progress. |
| 2 | Navigation icon | Opens the Calendar tab in Equipment hub. | Use to review remote inspections on the calendar. |
| 3 | One-time remote inspections section | Shows completed vs. total one-time remote inspections for the current year, next planned inspection time, All finished, or 0/0 with All finished. Includes a progress bar and a Cancel button when a planned one-time inspection exists. | Use to review or cancel a planned one-time remote inspection. |
| 4 | Scheduled remote inspections section | Shows the schedule frequency, completed vs. total scheduled inspections for the current year, Started… when an inspection is running, next scheduled inspection time, or All finished. Includes a progress bar and a Cancel button for the schedule. | Use to review or cancel the remote inspection schedule. |
| 5 | Legend | Shows succeeded and failed counts for the current year across one-time and scheduled remote inspections. | Use to understand inspection results by status. |
Canceling a scheduled remote inspection cancels the entire remote inspection schedule. A confirmation dialog appears before the schedule is canceled.
Events widget
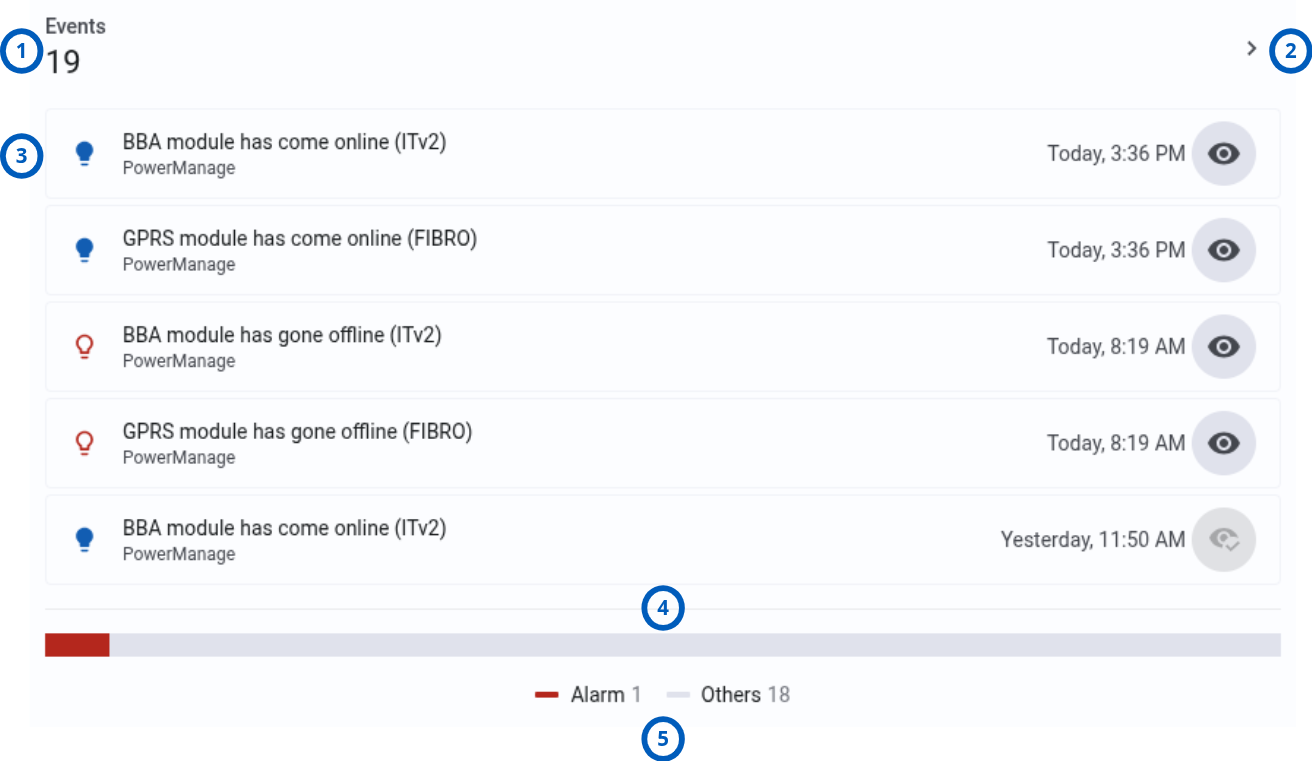
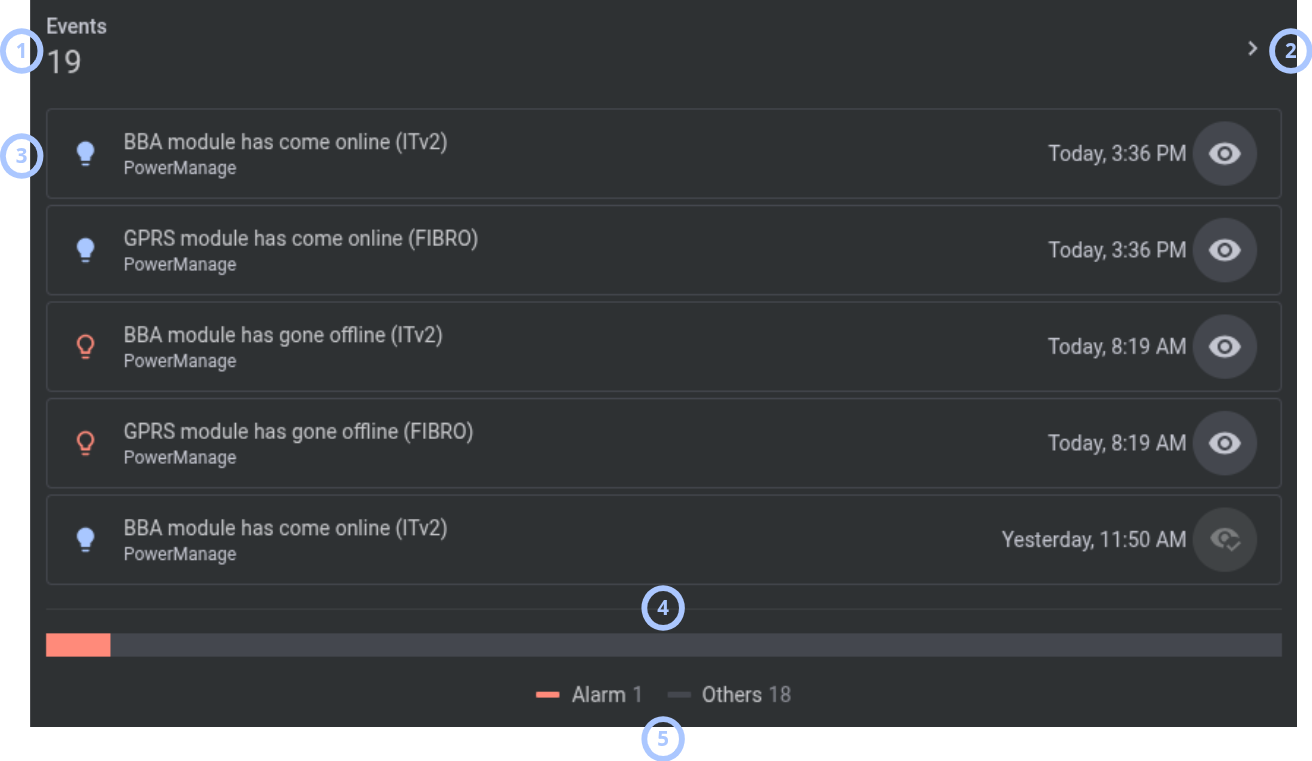
The Events widget shows the latest panel events and event distribution by severity.
| Callout | UI element | Description | When to use |
|---|---|---|---|
| 1 | Widget name and events count | Shows Events and the overall count of panel events received for this panel. The counter updates when a new event is received. | Use to review the number of events for the panel. |
| 2 | Navigation icon | Opens the Events page with filters applied for the selected panel. | Use to investigate panel events. |
| 3 | Event | Shows event icon, event description, event source, timestamp, and Mark as viewed button. The last five panel events are shown with the newest event on top. | Use to review recent events and mark them as viewed. |
| 4 | Events bar | Shows a color-coded horizontal bar for event distribution by severity type: Alarms and Others. The bar updates when new events are received and is hidden when no events exist. | Use to review event distribution by severity. |
| 5 | Legend | Shows Alarm and Others event types with color markers and count per type. | Use to understand event counts by type. |
Processes widget
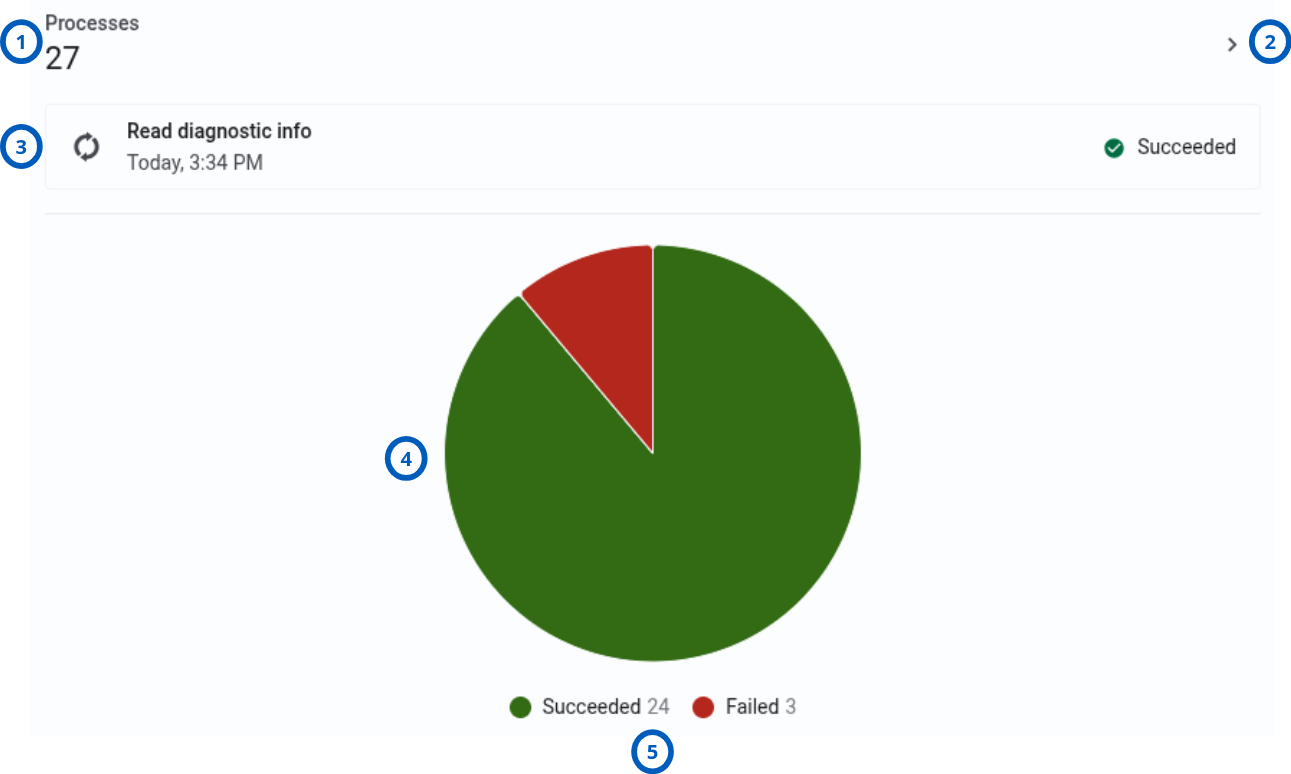
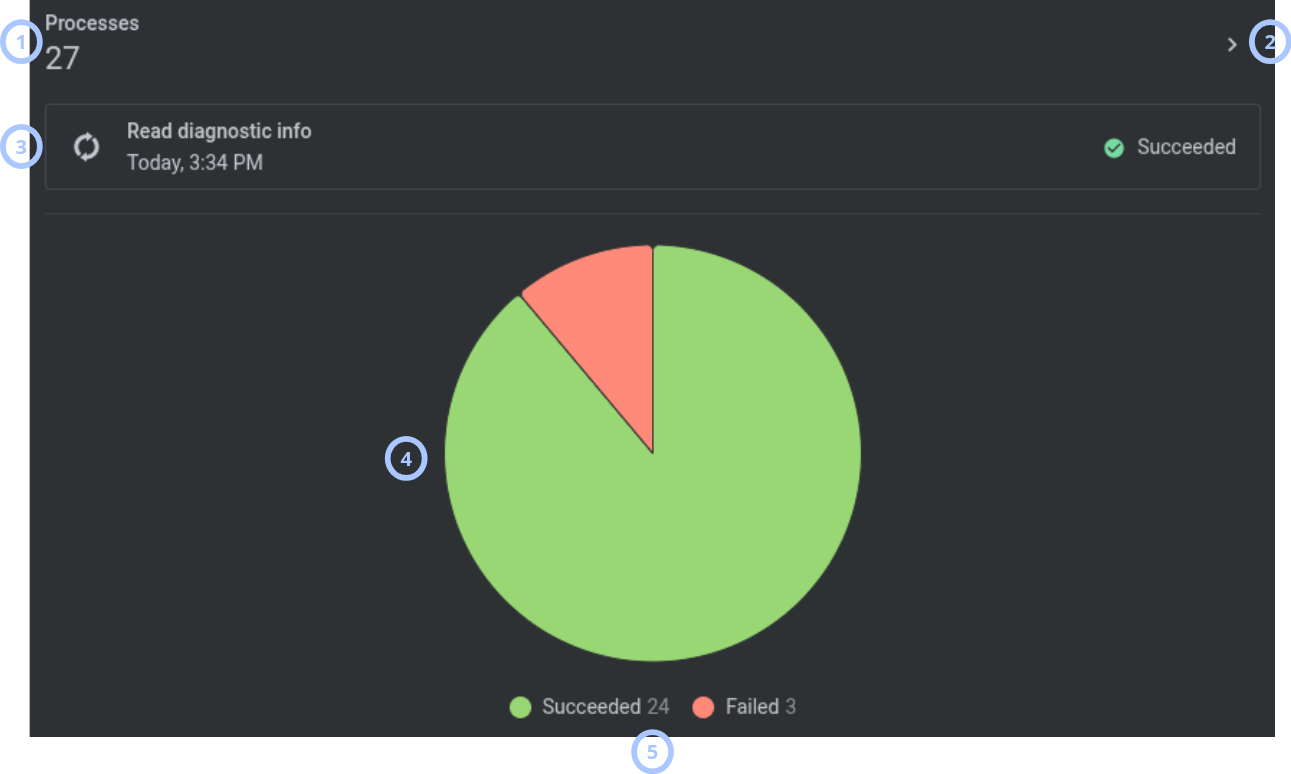
The Processes widget shows panel process activity and distribution by process status.
| Callout | UI element | Description | When to use |
|---|---|---|---|
| 1 | Widget name and processes count | Shows Processes and the overall count of panel processes. The counter updates when a process appears or completes. Only processes related to panels visible to the current user's role and group permissions are counted. | Use to review process volume for the panel. |
| 2 | Navigation icon | Opens the Processes page with filters applied for the selected panel. | Use to investigate panel processes. |
| 3 | Last process | Shows process icon, description, timestamp, and status. Example process descriptions include Refresh Configuration, Refresh State, Trigger Discovery, Remove Panel, and Emergency. | Use to review the latest panel process. |
| 4 | Processes chart | Shows a color-coded pie or donut chart for process status distribution: Succeeded, Failed, Started, and Handled. | Use to review process outcomes. |
| 5 | Legend | Shows process status types with color markers and process count per status type. Statuses can include Started, Handled, Succeeded, Failed, Failed to start, Not started, and Canceled. | Use to understand process counts by status. |
Panel info modal window
The Panel info modal window opens from navigation icons in the main widget. The available tabs can differ by panel model.
Action bar
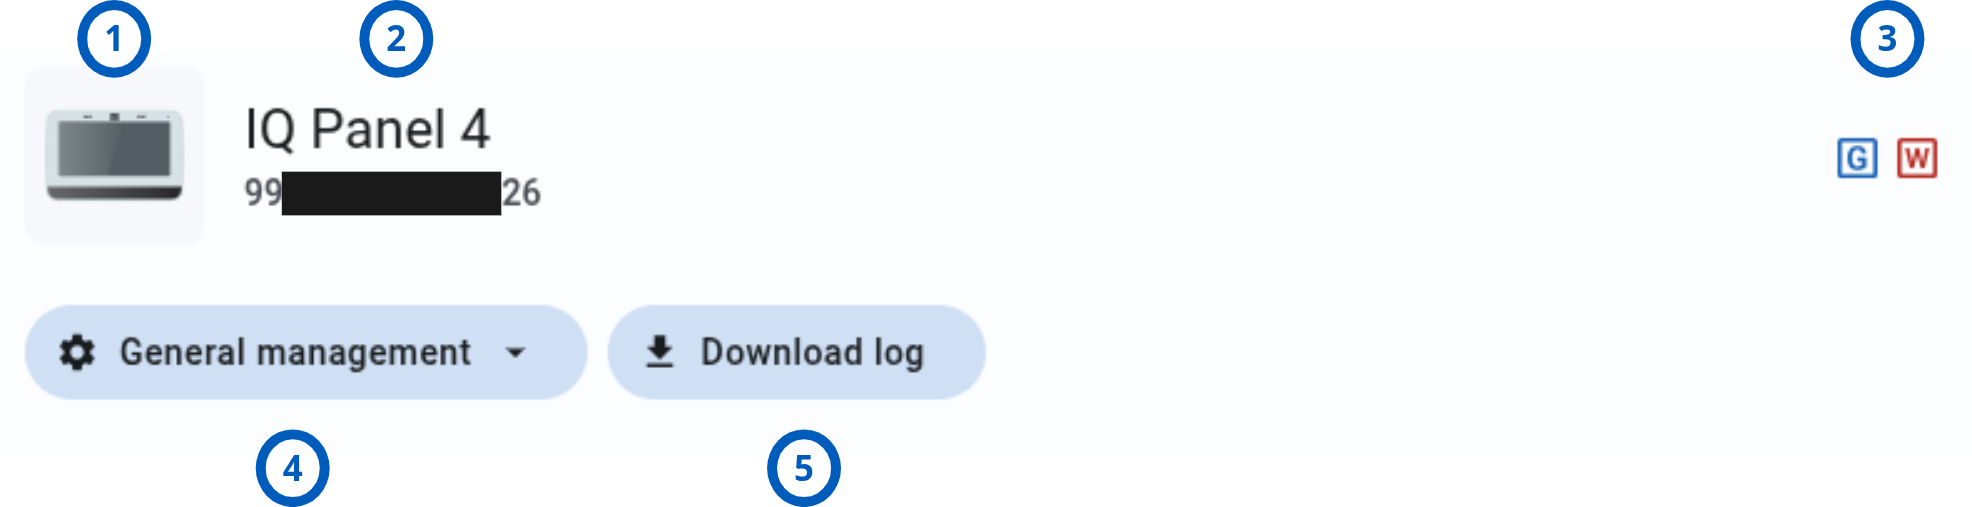
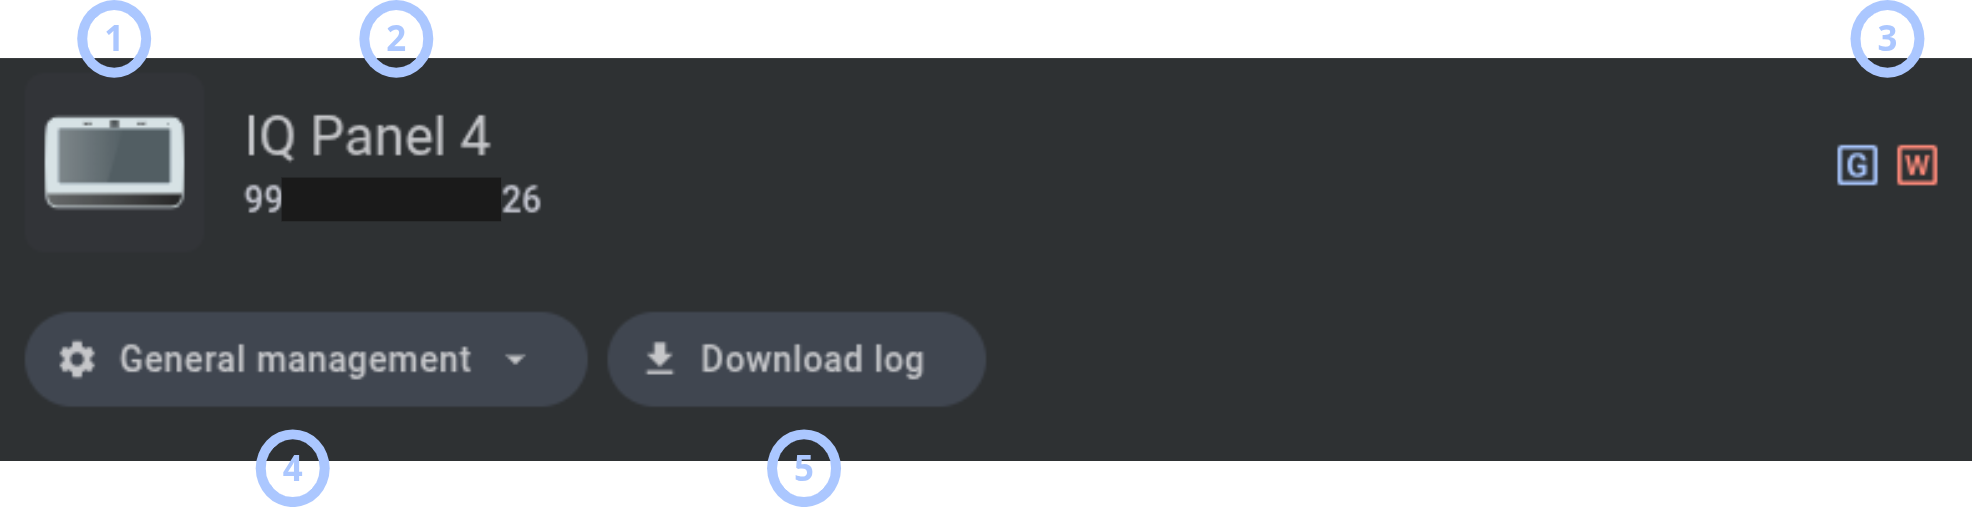
| Callout | UI element | Description | When to use |
|---|---|---|---|
| 1 | Panel icon | Shows the panel model icon for the panel model. | Use to identify the panel model. |
| 2 | Panel model and Panel ID | Shows the panel model and Panel ID. | Use to confirm which panel is open. |
| 3 | Communication channel icons | Shows color-coded icons for active communication channels, such as G for GPRS or Cellular, W for Wi-Fi, and B for BBA or Ethernet. Icons reflect connection status. | Use to review active communication channels. |
| 4 | General management button | Provides Reboot panel and Reboot modem actions. | Use to restart the panel or modem when supported and permitted. |
| 5 | Download log button | Downloads the panel log to IQMS servers for diagnostics. | Use to collect diagnostic logs for investigation. |
General tab
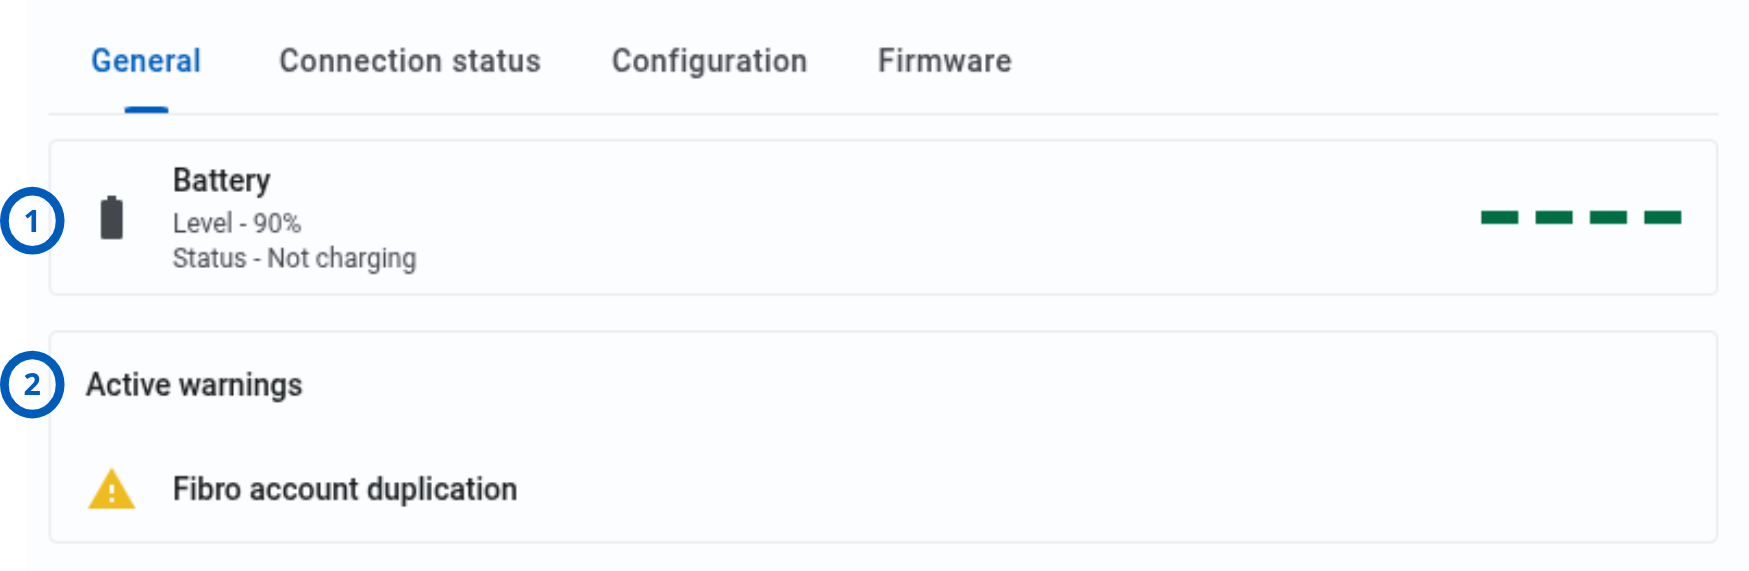
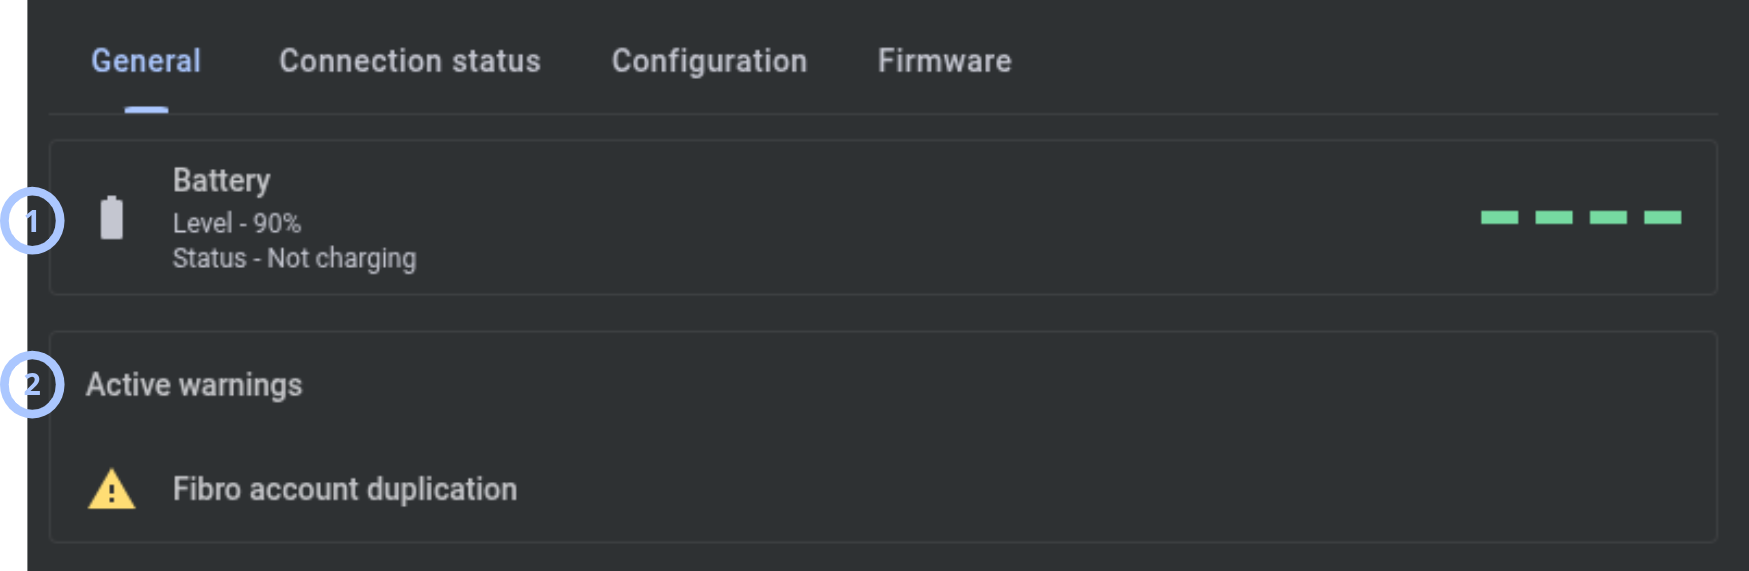
| Callout | UI element | Description | When to use |
|---|---|---|---|
| 1 | Battery level | Shows battery icon, level percentage, charging status, and color-coded battery level indicator. Available for IQ panels and panels with battery modules. | Use to review panel battery condition. |
| 2 | Active warnings | Shows active warning icons and descriptions, such as Fibro account duplication, Fibro swap, Fibro unencrypted, or Fibro encryption not supported. If no active warnings exist, the section can be empty or hidden. | Use to review active panel warnings. |
Connection status tab
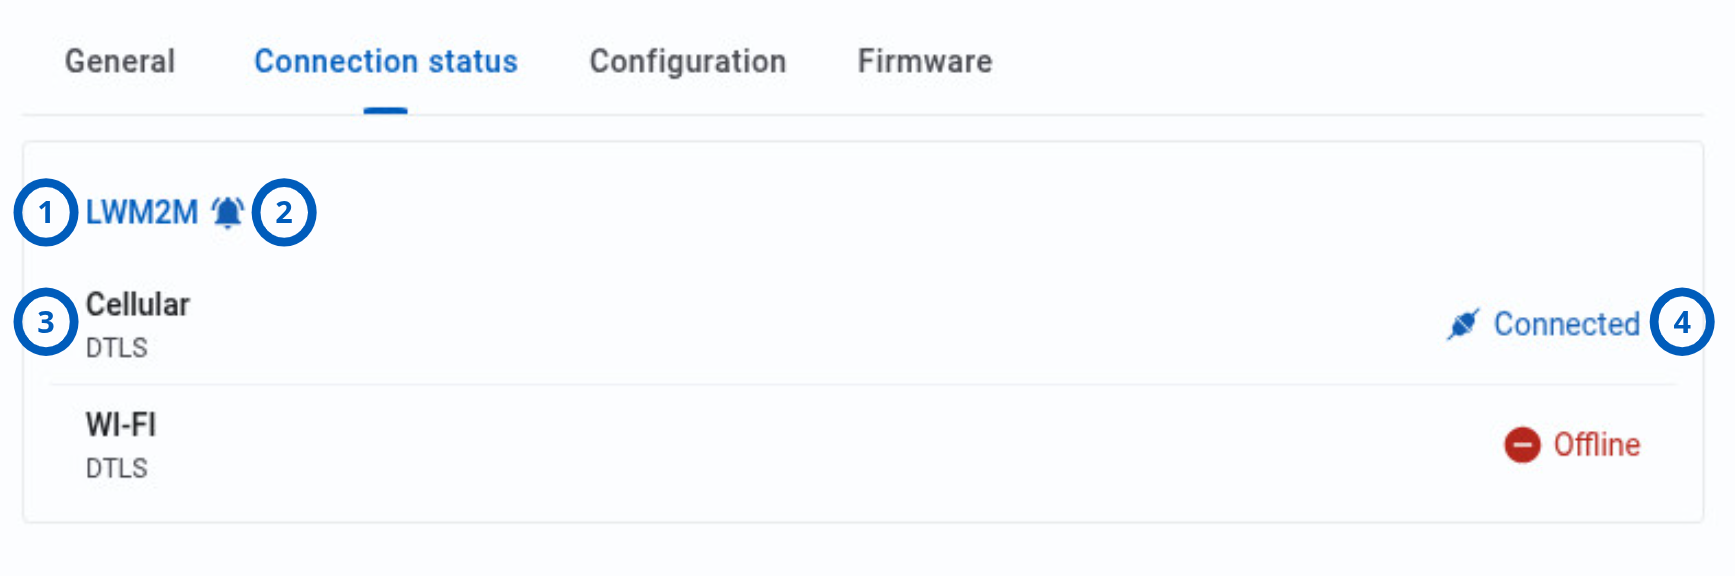
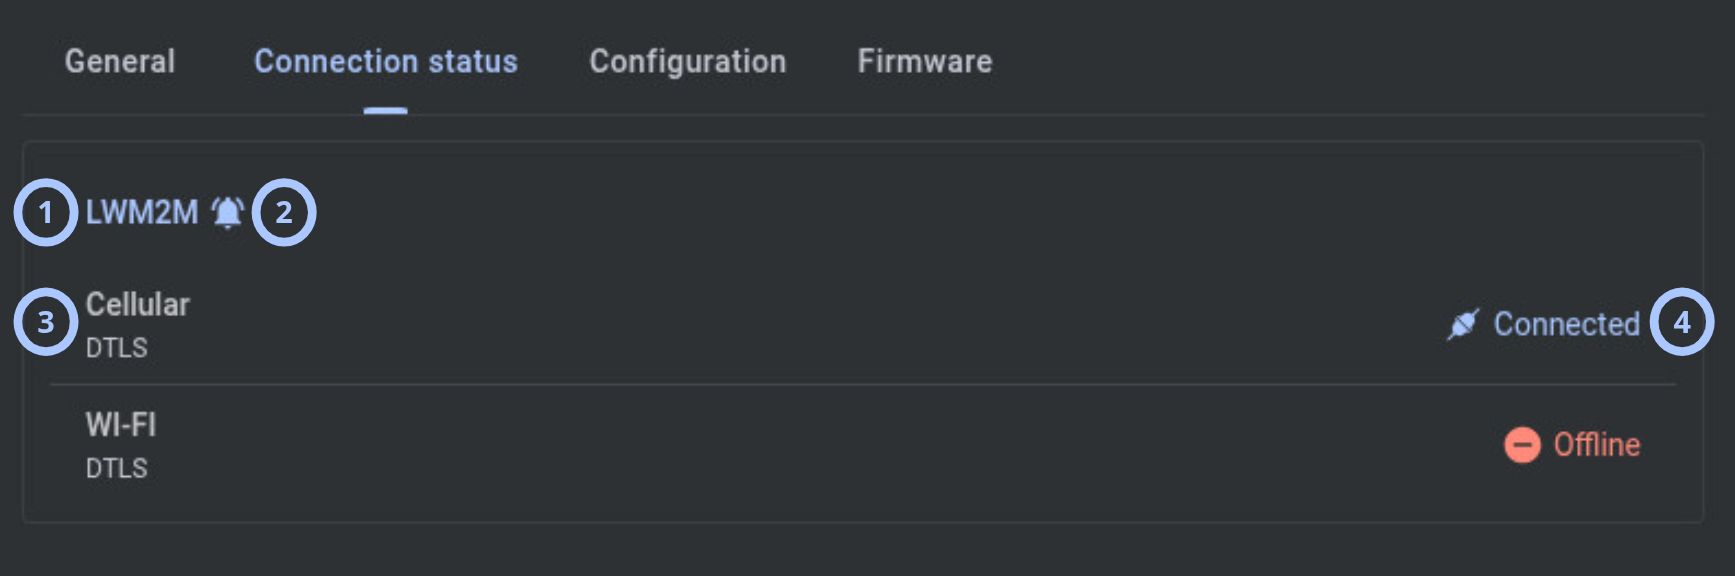
| Callout | UI element | Description | When to use |
|---|---|---|---|
| 1 | Connection protocol | Shows each configured communication protocol row, such as LwM2M, Fibro, or ITv2, with connection details. | Use to review panel protocols. |
| 2 | Event path icon | Shows a bell icon next to the protocol currently used to receive events from the panel. Only one protocol has this icon at a time. | Use to identify the event receiving path. |
| 3 | Protocol communication channel | Shows the channel used by each protocol, such as Wi-Fi, Cellular, or BBA/Ethernet, with the related channel icon. | Use to review protocol channels. |
| 4 | Protocol communication channel status | Shows the current connection status for each protocol and channel combination. | Use to troubleshoot protocol connectivity. |
Firmware tab
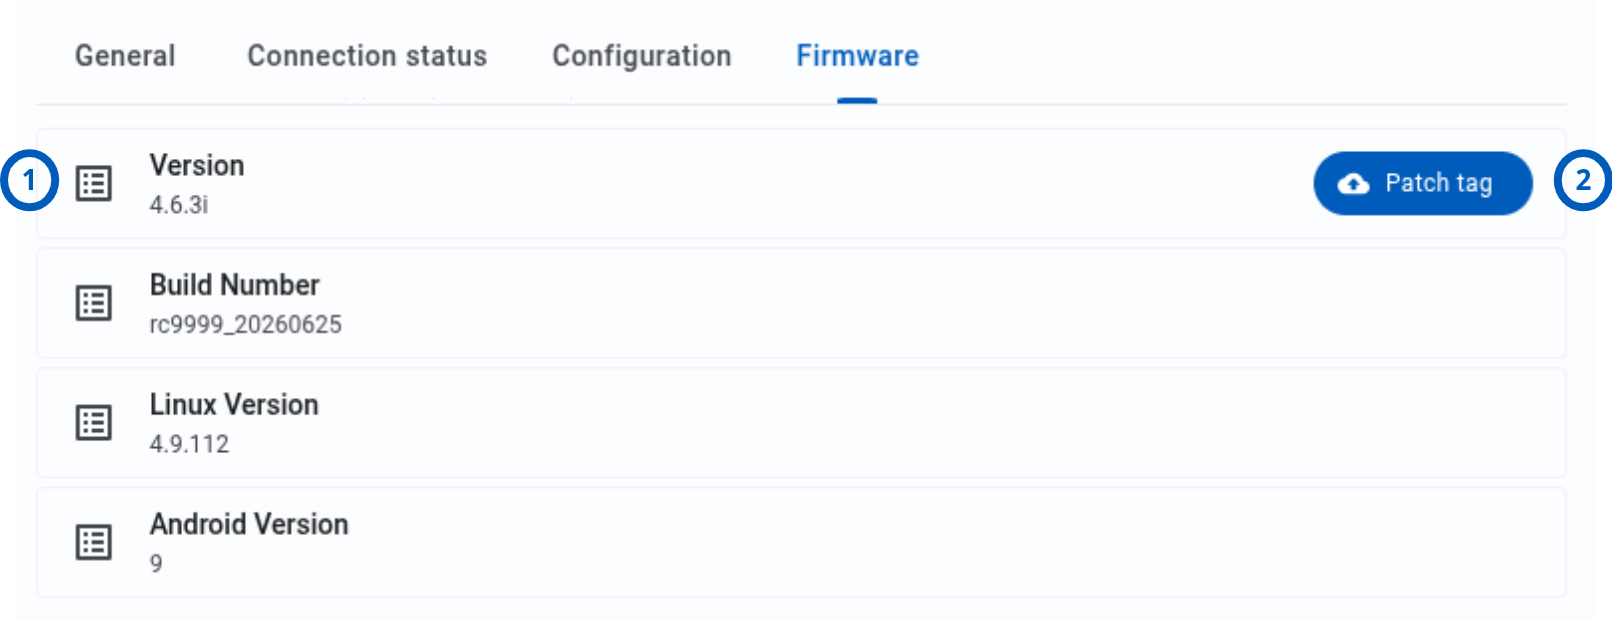
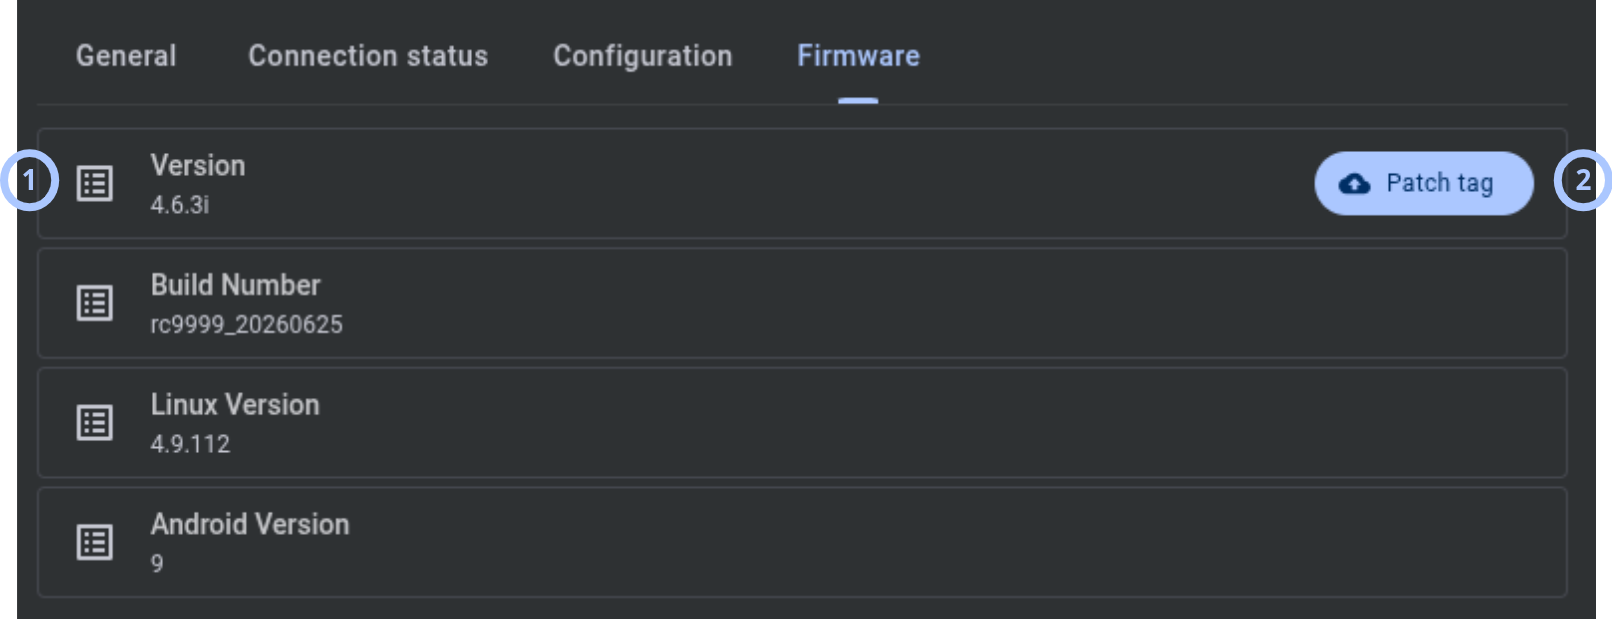
| Callout | UI element | Description | When to use |
|---|---|---|---|
| 1 | Firmware info item | Shows firmware and hardware version information for the panel. | Use to review panel version information. |
| 2 | Patch tag button | For IQ panels only, starts a Patch Tag Update by entering a patch tag name or selecting a package from the IQMS repository. The action starts the remote software upgrade process. | Use to start an IQ panel remote software upgrade. |
How to use this page
Open the Dashboard tab
Goal:
- Open the Dashboard tab for a selected panel.
Steps:
- Open the Equipment page.
- Select the panel that you want to review.
- In Equipment hub, select the Dashboard tab.
Expected result:
- The Dashboard tab opens.
- Dashboard widgets show available information for the selected panel.
Open the Panel info modal window
Goal:
- Review detailed panel information.
Steps:
- Open the Dashboard tab.
- In the main widget, select the navigation icon near the panel identity.
Expected result:
- The Panel info modal window opens.
- Available tabs are shown according to the panel model.
Review panel connection status
Goal:
- Review connection status and protocol sessions for the panel.
Steps:
- Open the Dashboard tab.
- In the main widget, review the Panel connection status area.
- In the Connection area, select the navigation icon.
- Review the Connection status tab in the Panel info modal window.
Expected result:
- The modal opens on the Connection status tab.
- Protocols, communication channels, and statuses are shown.
Review accounts assigned to the panel
Goal:
- Review assigned panel accounts.
Steps:
- Open the Dashboard tab.
- Review the Accounts widget.
- Select the navigation icon in the widget.
Expected result:
- The Users tab opens in Equipment hub.
- You can review assigned users and accounts.
Review installers assigned to the panel
Goal:
- Review assigned panel installers.
Steps:
- Open the Dashboard tab.
- Review the Installers widget.
- Select the navigation icon in the widget.
Expected result:
- The Installers tab opens in Equipment hub.
- You can review assigned installers.
Review panel devices
Goal:
- Review enrolled devices for the selected panel.
Steps:
- Open the Dashboard tab.
- Review the Devices widget.
- Select the navigation icon in the widget.
Expected result:
- The Devices tab opens in Equipment hub.
- You can review panel devices.
Add a new remark
Goal:
- Add a note for the selected panel.
Steps:
- Open the Dashboard tab.
- In the Remarks widget, select New remark.
- In the Additional actions and info modal window, enter the remark on the Remarks tab.
- Send the remark.
Expected result:
- The new remark is added to the panel remarks list.
- The remark can be viewed by other operators with access.
Review report progress
Goal:
- Review report execution summary for the selected panel.
Steps:
- Open the Dashboard tab.
- Review the Reports widget.
- Review one-time, daily, weekly, and monthly report sections.
- Select the navigation icon if you need to open the Calendar tab.
Expected result:
- Report progress is shown by frequency type.
- The Calendar tab opens when you select the navigation icon.
Review remote inspections
Goal:
- Review one-time and scheduled remote inspections for the selected panel.
Steps:
- Open the Dashboard tab.
- Review the Remote inspections widget.
- Review one-time and scheduled remote inspection sections.
- Select the navigation icon if you need to open the Calendar tab.
Expected result:
- Remote inspection progress for the current year is shown.
- The Calendar tab opens when you select the navigation icon.
Review recent panel events
Goal:
- Review the latest panel events.
Steps:
- Open the Dashboard tab.
- Review the Events widget.
- Select Mark as viewed for an event if needed.
- Select the navigation icon if you need to open the Events page.
Expected result:
- The latest panel events are shown.
- The Events page opens with panel filters when you select the navigation icon.
Review panel processes
Goal:
- Review recent and summarized panel process activity.
Steps:
- Open the Dashboard tab.
- Review the Processes widget.
- Review the last process, chart, and legend.
- Select the navigation icon if you need to open the Processes page.
Expected result:
- Panel process information is shown.
- The Processes page opens with panel filters when you select the navigation icon.
Enable or disable app access
Goal:
- Control customer or installer application access for the selected panel.
Steps:
- Open the Dashboard tab.
- In the main widget, enable or disable Customer app.
- Enable or disable Installer app.
Expected result:
- Customer access through ConnectAlarm is enabled or disabled.
- Installer access through AlarmInstall is enabled or disabled.
Review connection bulb status
Goal:
- Understand the current connection status between the panel and the server.
Steps:
- Open the Dashboard tab.
- In the main widget, find Panel connection status.
- Review the bulb color.
- Hover over the bulb to see the connection status description.
- Review the communication channel icons next to the bulb.
Expected result:
- You can identify whether the panel is connected, online, offline, or installed without keepalive supervision.
- You can identify which communication channels are present and available.
Field and option reference
Panel connection status
The bulb color shows the connection status between the panel and the server. Hover over the bulb to see a text description of the connection status.
| Icon | Status | Description |
|---|---|---|
 | Connected | The panel has an open connection to the server. Commands from the server execute immediately. This is the highest-priority status — if the panel is connected via any channel, the bulb shows blue regardless of other channel statuses. |
 | Online | The panel is online. The server receives keepalive messages from the panel within the configured lifetime period. There is no active open session, but the panel is reachable — commands require the panel to connect first. If at least one protocol/channel is online, the bulb shows green. |
 | Offline | The panel is offline. There is no open connection, and the server does not receive keepalive messages from the panel. The panel is unreachable — commands cannot be delivered until the panel connects. |
 | Installed | Keepalive messages are disabled in the group that the panel is associated with. The server has no supervision over the panel's availability — Online/Offline status cannot be determined. The panel may still report events, but its liveness is not monitored. |
The communication channel icons show which channel is used by the panel.
| Icon | Description |
|---|---|
  | Indicates that the panel is communicating with the server via a cellular connection (GPRS). |
  | Indicates that the panel is communicating with the server via a Wi-Fi connection. |
  | Indicates that the panel is communicating with the server via an Ethernet (broadband) connection. |
  | Indicates that the panel is communicating with the server via a cellular connection through an Ethernet board. |
The communication channel icon color shows the channel status.
| Icon | Status | Description |
|---|---|---|
  | Installed | Indicates that the communication module is physically installed in the panel, but no communication channel is present or configured or if the communication channel is configured, but keepalive messages are disabled in the panel's group settings, or the channel is configured but currently disconnected. |
  | Online | Indicates that the panel has an active communication channel and the server is receiving keepalive messages from the panel. |
  | Connected | Indicates that there is an open active connection (session) between the panel and the server. |
  | Offline | Indicates that the panel has a communication channel configured, but the server is no longer receiving keepalive messages from the panel. |
Tips
- Confirm the panel ID and account code before you use widget actions.
- Use the main widget to quickly review connection status, troubles, alarms, billing plan, and app access.
- Use widget navigation icons to open the related Equipment hub tab or filtered page.
- Review chart legends before comparing reports, remote inspections, events, or processes.
- Check role permissions if a widget, count, button, or navigation icon is not visible.
Troubleshooting
Widget data is not visible
Possible causes
- No related data exists for the selected panel.
- Your role does not allow viewing the widget data.
- The selected panel has not completed discovery.
What to do
- Confirm that the selected panel is correct.
- Refresh the page.
- Confirm that your role allows viewing the related data.
Navigation icon does not open the expected tab or page
Possible causes
- Your role does not allow access to the destination tab or page.
What to do
- Confirm your role permissions.
- Refresh Equipment hub.
- Select the navigation icon again.
- Open the destination tab or page manually if needed.
Billing plan is not shown
Possible causes
- The selected panel does not support the billing plan widget.
- Your role does not allow viewing billing information.
What to do
- Confirm the panel model.
- Confirm that the panel is in a dealer group.
- Confirm your billing permissions.
Events widget does not show the latest event
Possible causes
- No new event was received for the panel.
- The event list has not refreshed.
- The current user does not have permission to view the event.
What to do
- Refresh the Dashboard tab.
- Open the Events page with the widget navigation icon.
- Confirm your event permissions.
Customer app login fails after enabling the toggle
Possible causes
- The installation requires an active billing plan.
- The billing plan is not active.
- The panel is not available for customer app access.
What to do
- Review the Service plan in the main widget.
- Open the Billing plan modal.
- Confirm that the billing plan is active.
Panel info modal does not show an expected tab
Possible causes
- The selected panel model does not support the tab.
- The panel has not reported the required data.
- Your role does not allow viewing the tab or action.
What to do
- Confirm the panel model.
- Refresh the panel information.
- Confirm your role permissions.
- Check whether the data is available on another Equipment hub tab.