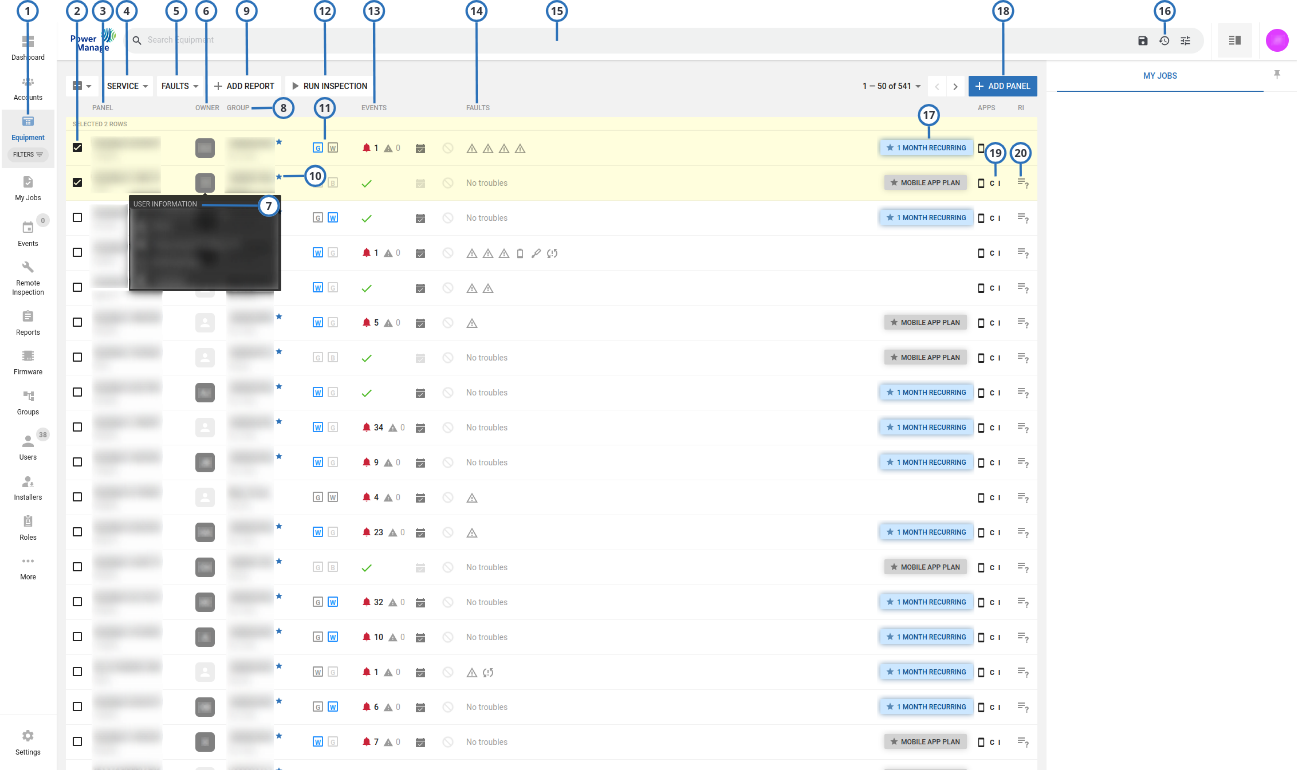
Navigating the Equipment page
You can view a list of all of the panels that are enrolled on the server on the Equipment page.
Figure. Navigating the Equipment page
| Callout | Name | Description |
|---|---|---|
| 1 | Equipment | |
| Customized search filters that you create for the Equipment page appear here. For more information, see Using the search filter. | ||
| The preset Faulty Panels and Suspended Faults search filters appear by default. Click Faulty Panels to filter the panels page to only display panels with faults. Click Suspended Faults to filter the panels page to only display panels with suspended faults. Press the X icon on a filter to remove it. If no filters exist then the FILTERS menu will not be shown. | ||
| 2 | Check box | Select the check box of one or more panels to enable SERVICE, FAULTS, CREATE REPORT, and RUN INSPECTION. |
| 3 | Panel filter | |
Displays the panel name and panel ID. By default, the panel name is the panel ID. To change this to a custom name, edit the panel information in the Equipment hub. For more information, see EDIT in Navigating the equipment hub. For more information on changing the panel name or account, see Editing basic panel and customer information. note For Neo panels, the panel ID is the integration identification number. To
find this number, enter | ||
| Select the panel name to open the panel in the Equipment hub. For more information about the Equipment hub, see Equipment hub. | ||
| 4 | Service | |
To perform an action on one or more selected panels, from the SERVICE list, select one of the following options:
For more information on servicing panels, see Servicing panels. | ||
| To enable SERVICE, select the check box of one or more panel rows. | ||
| 5 | FAULTS | |
To perform an action on one or more selected panels, from the FAULTS list, select one of the following options:
For more information on servicing panels, see Servicing panels. | ||
| To enable FAULTS, select the check box of one or more panel rows. | ||
| 6 | Owner | Displays the owner's initials. Hover over the owner's initials to view more owner information. For more information, Owner information (7 row). |
| 7 | Owner information | Hover over the owner's initials to view the following owner information:
|
| 8 | GROUP column | |
| The group that the panel connects to, and the model of the panel, displays in the GROUP column. For more information about groups, see Groups page. | ||
| Click the group name to open the group hub. For more information about the group hub, see Groups hub. | ||
| 9 | CREATE REPORT | |
| Click to create a new report for one or more selected panels. For more information about creating a report, see Creating new reports and Creating a new report on the Equipment page. | ||
| To enable CREATE REPORT, select the check box of one or more panel rows. | ||
| 10 | Star icon | A star marks the dealers’ groups. For more information about dealers’ groups, see Dealer registration. |
| 11 | Connection status | The G icon represents a GPRS or cellular connection, the W icon represents the Wi-Fi connection, and the B icon represents an Ethernet or broadband connection. The color of an icon represents the following information:
note You can only disable keepalive messages for Neo panel groups |
| 12 | RUN INSPECTION | Click to create a new inspection for one or more selected panels. For more
information about creating an inspection, see Creating a remote inspection
for a batch of panels and Scheduling a remote inspection for an individual
panel. |
| 13 | EVENTS column | |
| The EVENTS column contains a summary of alarm and alert events. The bell symbols indicate an alarm and the warning symbol indicates an alert. The green tick indicates a no alarms or alerts. For more information on events, see Event severity in Navigating the Events page. | ||
| Click the bell symbol to view a list of alarms from the panel and click the warning symbol to view a list of alerts from the panel. | ||
| If there are no events, or all events are resolved, a green check mark displays. | ||
| 14 | FAULTS column | |
| The FAULTS column displays any faults that affect the panel. | ||
| Hover over a fault icon to see a detailed description of the fault. Click a fault to view a list of all faults from the panel. | ||
| If a panel is marked for service, a user icon appears to left of the FAULTS column with the initial of the user that is assigned to service the panel. For more information about marking or reassigning a panel for service, see Marking a panel for service in the Equipment hub and Reassigning one or more panels that are marked for service. | ||
| 15 | Search bar | In the search bar, search for a panel with the key-value pairs or by typing a search term. You can also type a search term to find a panel with private data, such as name, phone number, email address, and home address, that is available in the INFO tab of a panel in the Equipment hub. |
| 16 | Last panel viewed | Click to view the last panel viewed in the Equipment hub. |
| 17 | Billing plan button | For the IQ panels displays and sets the billing plan for the panel. For more
information, see Billing plan. You can set up Short view or Full view for the billing plan button. For more information, see Billing status view. |
| 18 | ADD PANEL | Click to add a new panel to the server. For more information on adding a panel to the server, see Adding panels to the server. |
| 19 | Customer and installer apps | Click to open the customer and installer apps dialog box and perform one of the following actions:
|
| 20 | RI column | |
| The RI column displays the status of the last remote inspection. | ||
| Click the RI icon to open the panel on the REMOTE INSPECTIONS tab in the equipment hub. For more information about REMOTE INSPECTIONS tab, see Remote inspections tab. |
- Servicing panels
- Adding panels to the server
- Assigning a panel to a different group
- Creating a new report on the Equipment page
- Marking one or more panels for service on the Equipment page
- Pushing a basic configuration to one or more panels
- Reassigning one or more panels that are marked for service
- Refreshing a panel configuration
- Resolving faults in one or more panels
- Suspending faults in one or more panels