Panel dashboard
The panel dashboard summarizes most of the panel information, options, and commands.
Pressing the > icon, switches to the related panel tab (DEVICES tab, OUTPUTS tab, etc.).
To view the dashboard of a panel, on the navigation pane, click Equipment > the panel name > DASHBOARD:
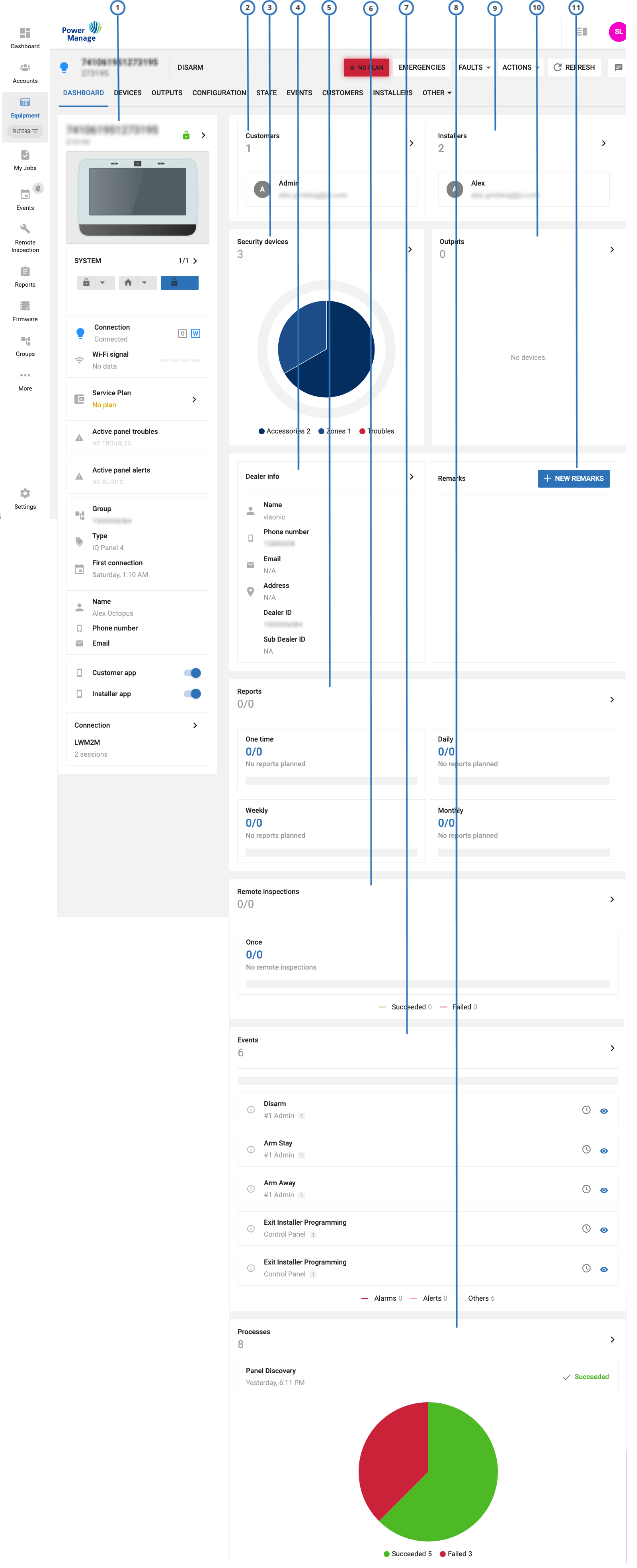
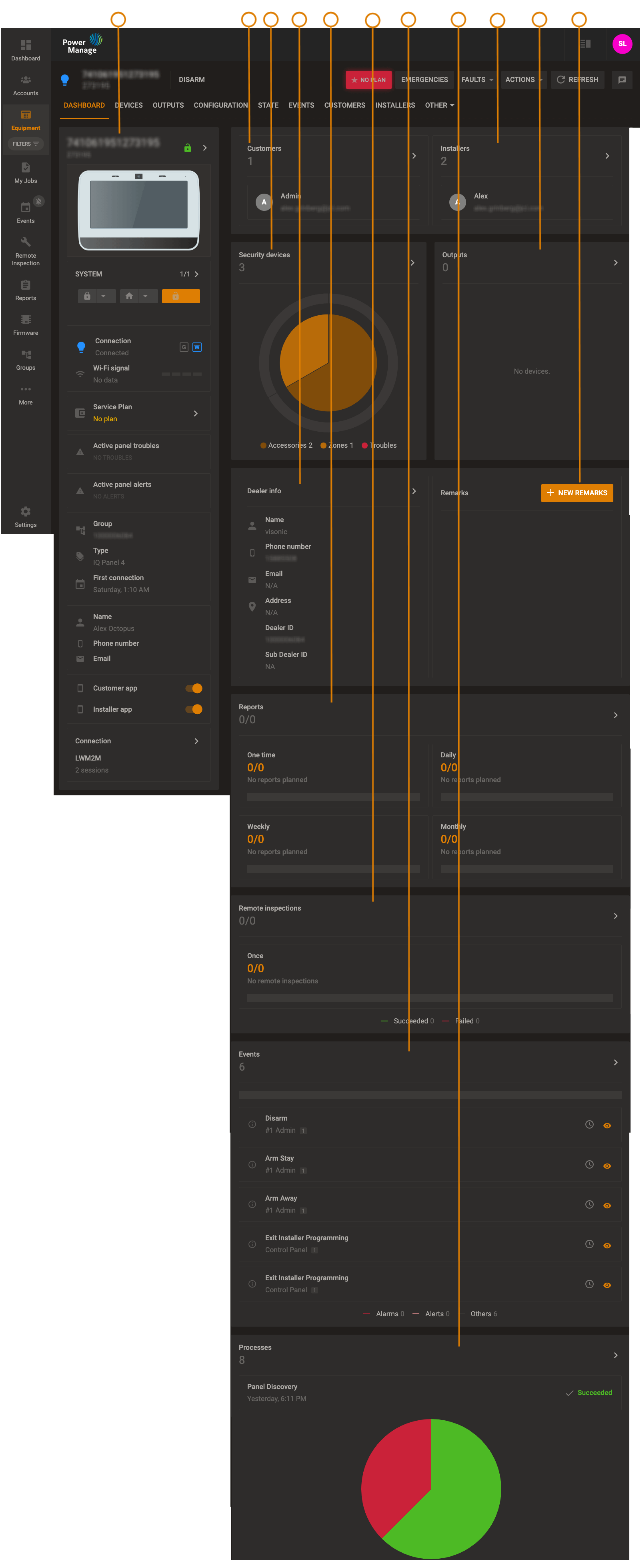
| Callout | Name | Description |
|---|---|---|
| 1 | Status overview |
|
| 2 | Customers | All customers of panel |
| 3 | Devices | Number of automation and security and device troubles |
| 4 | Dealer info | Dealer info |
| 5 | Reports | List of recent done and future reports |
| 6 | Remote inspection | List of done and future remote inspections & succeeded/failed reports |
| 7 | Events | Last events & number of Alarms, alerts and other events |
| 8 | Processes | Last processes & number of succeeded and failed processes |
| 9 | Installers | All installers of panel installers |
| 10 | Outputs/Automation | Lists all devices which are not security PGM in case of Outputs and PGM & ZWave & ZigBee & PG+ in case of automation |
| 11 | Remarks | The remarks from the Info tab |
Related topics
Was this page helpful?